I’ve been wanting to try out Dissect more often so that I can understand its strengths and limitations. Last time I mainly used it interactively, which is very useful for triage. While I’ll do that again to start in this case, my goal this time is to get closer to bulk ingesting and super-timelining, or maybe even working with their Python API.
Challenge Approach
My goal here is to identify all artifact types that may be involved and to make a super-timeline that I can work with, outputting it as a spreadsheet. This output can be refined until it includes mostly relevant artifacts. First, I’ll have to triage what’s happening since all we know is that some malicious program was probably run. Here’s the scenario:
The user downloaded what they thought was the SysInternals tool suite, double-clicked it, but the tools did not open and were not accessible. Since that time, the user has noticed that the system has “slowed down” and become less and less responsive.
It’s interesting that this challenge sounds approachable from the malware reversing angle. Of course, this may not be the case if the malware was a downloader and didn’t have the payload embedded in it. But we’re focused on forensics this time. What happened and when? My first thought is to look for any artifacts related to download and execution, find the time period of interest, then do a super-timeline of the surrounding 5 minutes or so.
First things first, we’ll get some general information about the host using the following command:
target-query SysInternalsCase.E01 -f osinfo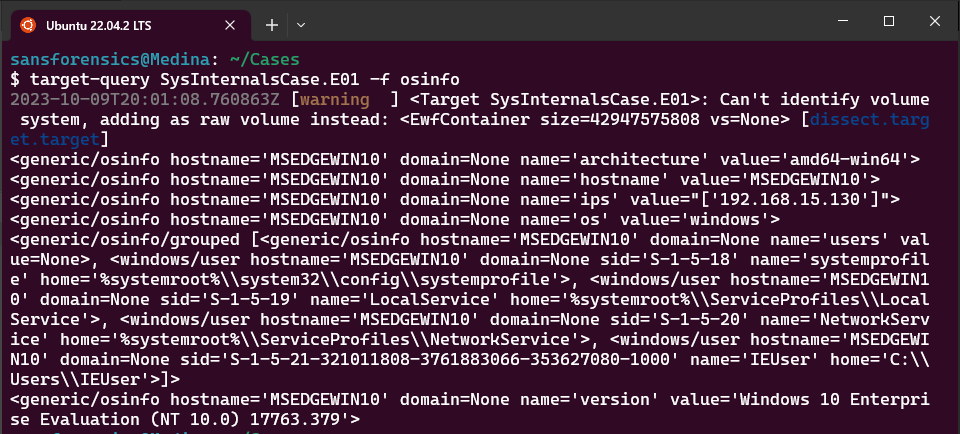
| OS version, Architecture | Windows 10 Enterprise (amd64) build 17763.279 |
| Hostname | MSEDGEWIN10 |
| IPs | 192.168.15.130 |
| Primary User | IEUser |
Artifact Fields and Basic Searching
Next, a shot in the dark: let’s just look for something in the Amcache or Prefetch with the name SysInternals. It turns out there was no output of the Prefetch plugin, so I went with Amcache first. Determining which field to search requires some testing to determine which fields are available in the artifact. If you want to list fields and their types, pipe your plugin to rdump -l like this:
target-query SysInternalsCase.E01 -f amcache | rdump -l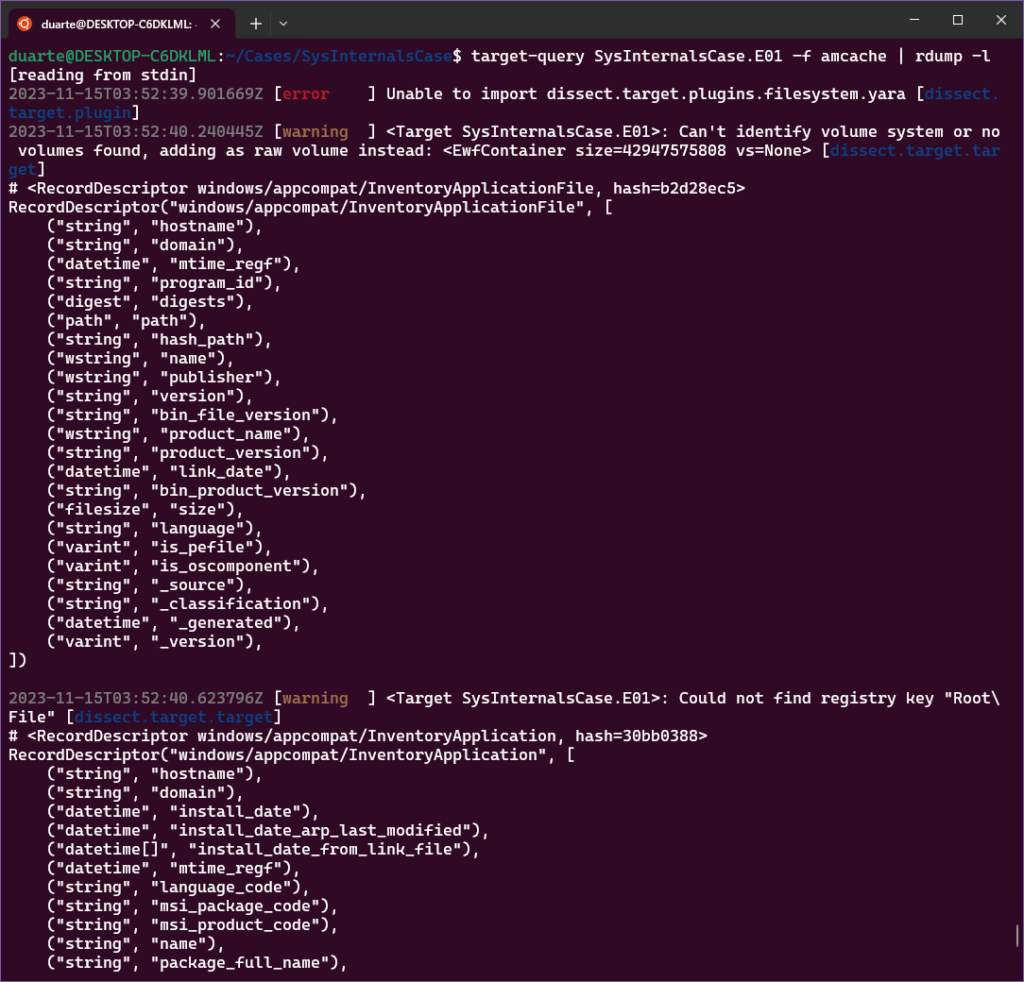
In this case, there are 3 types of flow records present: DeviceContainer, InventoryApplication, and InventoryApplicationFile. In our case I’m thinking we’re interested in InventoryApplicationFile records. So, for our first shot at our query for records related to SysInternals, we’re going to use the field “path,” which in this case has the type of a typical Python Path (this was just recently changed from the type URI as I wrote the blog, so you may have to change some scripts if you treated this field as a string in the past). I think this is great, as there are all kinds of manipulations you can do with Paths. The good news is that this is a Windows Path and is case-insensitive (we can test this).
In addition to that path field matching SysInternals, I’d like any timestamps related to this record to be separated out so we can see distinct events separately. So I’ll also use the –multi-timestamp argument and we end up with this command:
target-query SysInternalsCase.E01 -f amcache | rdump --multi-timestamp -s "r.path.match('*sysinternals*')"If you like, you can also run the following command to test whether the case matters when we use the matches method of a Path object:
target-query SysInternalsCase.E01 -f amcache | rdump --multi-timestamp -s "r.path.match('*SysInteRnals*')"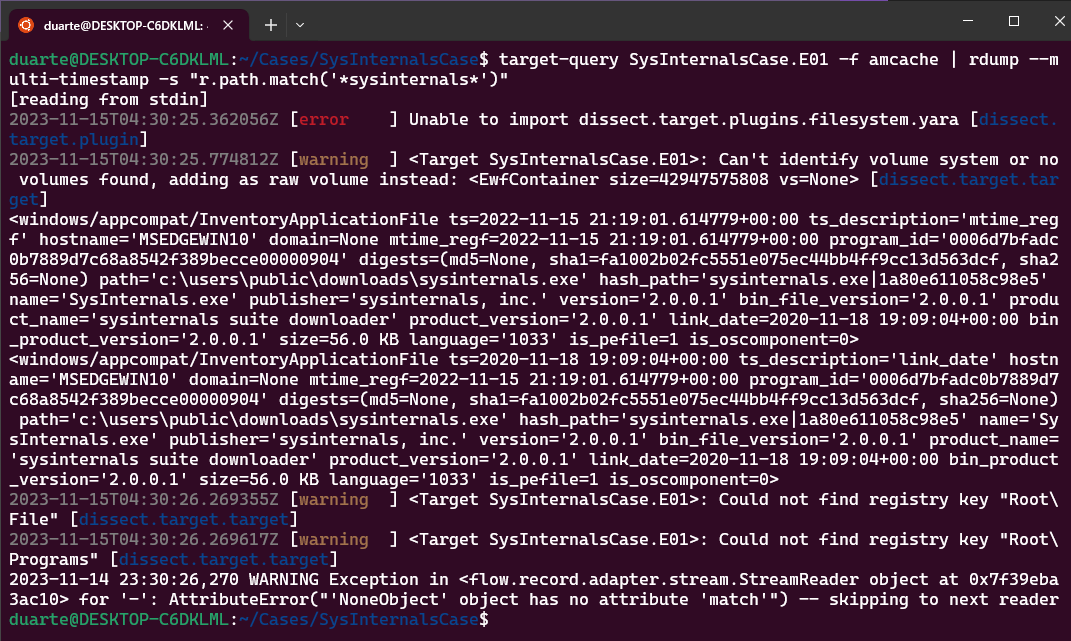
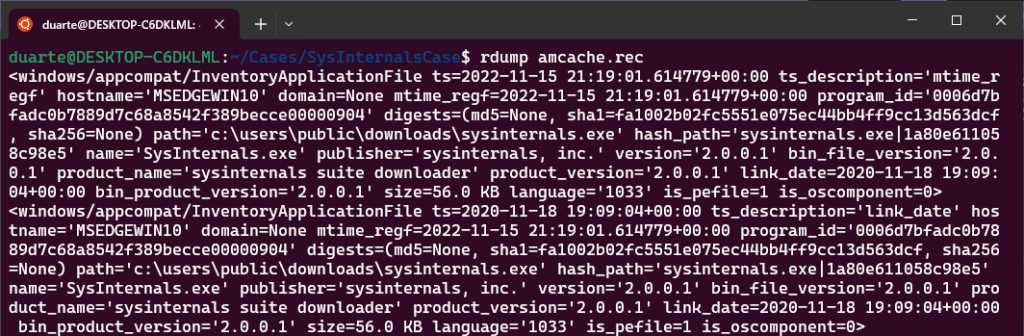
Good, in this case we got two events related to the same file. In addition to the path and sha1 hash being the same, we can see that the program ID is the same as well (0006d7bfadc0b7889d7c68a8542f389becce00000904). We can see the timestamp for the modification time in the Registry is 2022-11-15 21:19:01 while the timestamp for when the executable was linked is 2020-11-18 19:09:04 (dissect outputs timestamps in UTC).
Adding Context with the MFT Plugin
Now that we have an indication of an amcache entry being created, I want to add MFT records to this to provide some context. Which field should I use for records from that plugin?
target-query SysInternalsCaseE01 -f mft | rdump -l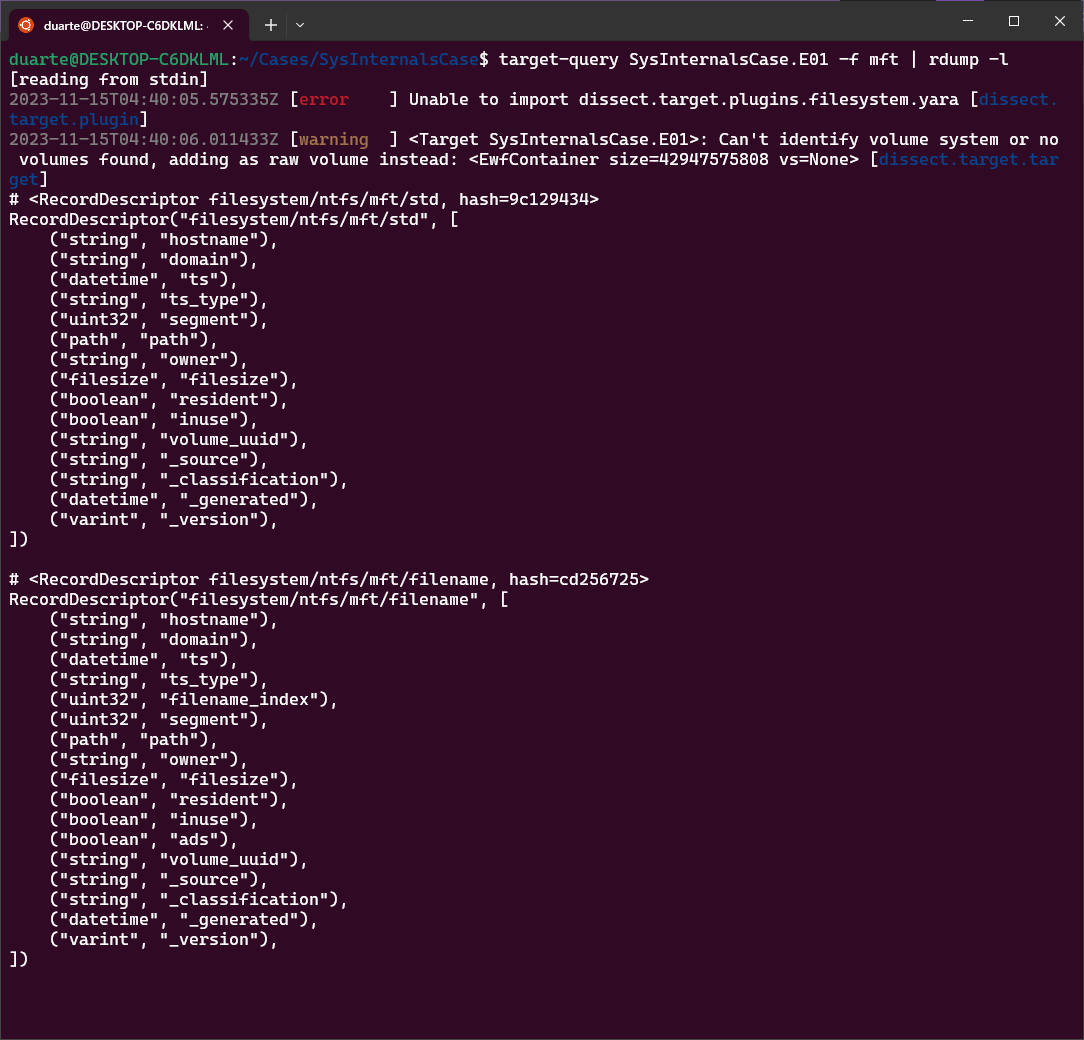
According to the field list, both the FILE_NAME and STANDARD_INFORMATION records have the field “path” as well. So ideally we could just run:
target-query SysInternalsCase.E01 -f amcache,mft | rdump --multi-timestamp -s "r.path.match('*sysinternals*')"For some reason this didn’t work though. I think it’s due to some incompatibility between the plugins? I was getting some errors related to a broken pipe, but they weren’t too descriptive. Since this selection statement works fine with the amcache records, I went ahead and ran the same query with just the mft plugin alone. (Note: this command will take on the order of 15-20 minutes). I decided to write the filtered output of the MFT command to a .rec file so we can work with the output again quickly (I also recommend this when using the evtx plugin):
target-query SysInternalsCase.E01 -f mft | rdump --multi-timestamp -s "r.path.match('*sysinternals*')" -w mft_filtered.recWith that being said, I get the feeling I’ll be working mostly with its JSON output for the sake of scripting in Python when things get up to scale.
Combining Multiple Artifacts
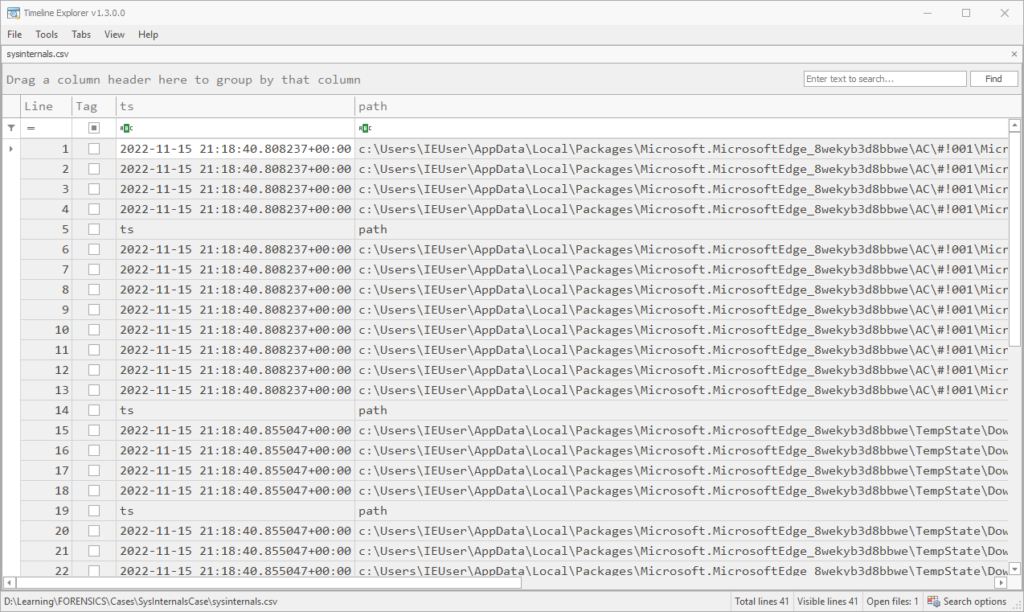
Anyways now that we have the records file mft_filtered.rec, we can make it into a .csv and/or select columns of interest using rdump again. For the purposes of this exercise, all we care about is timestamp, path, artifact name and timestamp type. So I dump to a csv using this command:
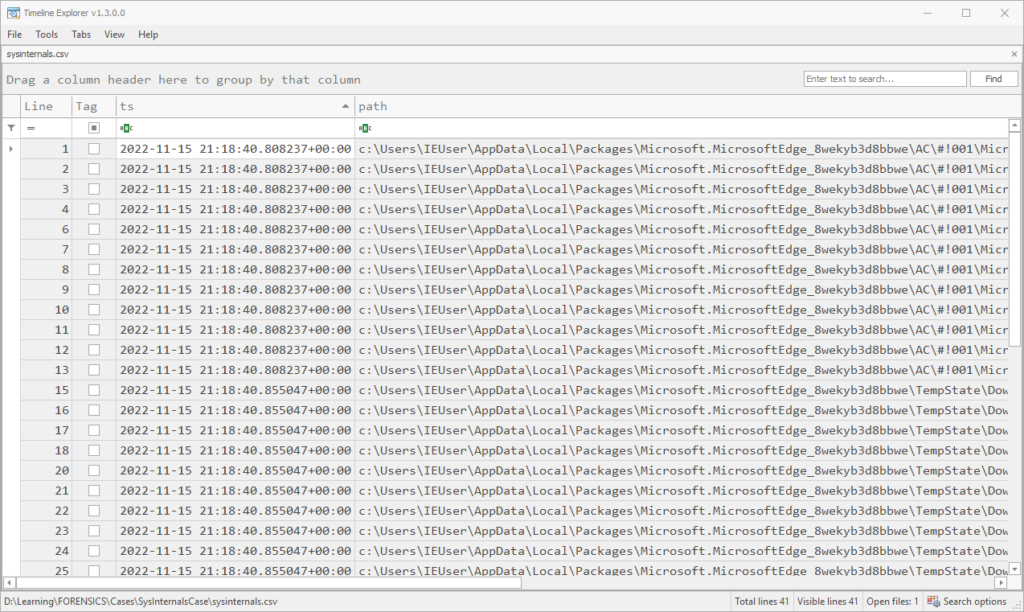
rdump mft_filtered.rec -F ts,path,ts_type --csv -w sysinternals.csvThis gives good output, even though it seems a bunch of header rows are interspersed. It’s easy to remove these once you sort by the first column.
However, if you’d prefer to work with text and are only interested in a couple of fields, you can format this as text and won’t end up with the extraneous headers:
rdump mft_filtered.rec -f {ts},{path},{ts_type}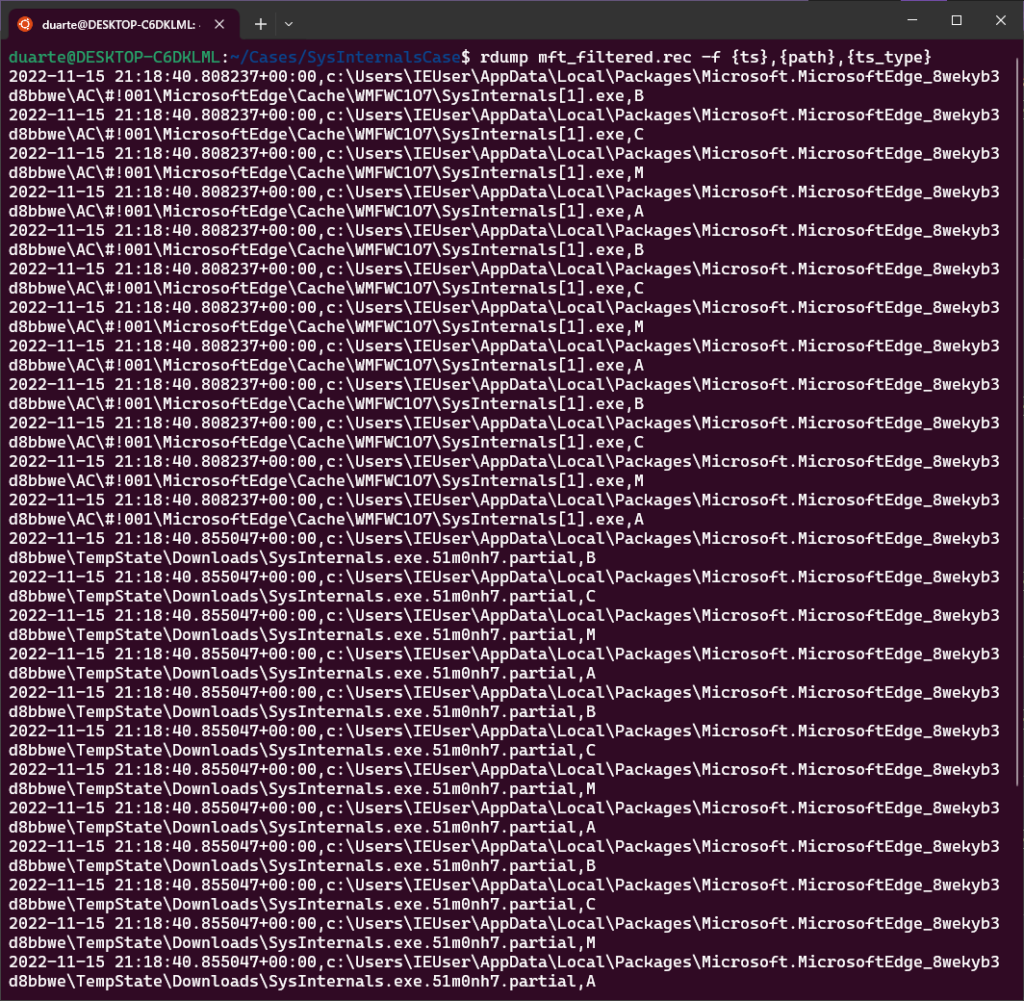
In any case, once things are sorted we can see that the MFT has file entries for this SysInternals.exe file in the Microsoft Edge Cache, as a .partial file in the TempState\Downloads folder, and finally at the path C:\Users\Public\Downloads\SysInternals.exe.
So now, how can we combine the timestamps from these two plugins (amcache and mft) into one CSV? To do this, I first dumped amcache records matching “sysinternals” to a file named amcache.rec:
target-query SysInternalsCase.E01 -f amcache | rdump --multi-timestamp -s "r.path.match('*sysinternals*')" -w amcache.recWe can check that there’s content in the .rec file by using the command rdump amcache.rec:
And next, to combine these two record types into one CSV, I used the following command:
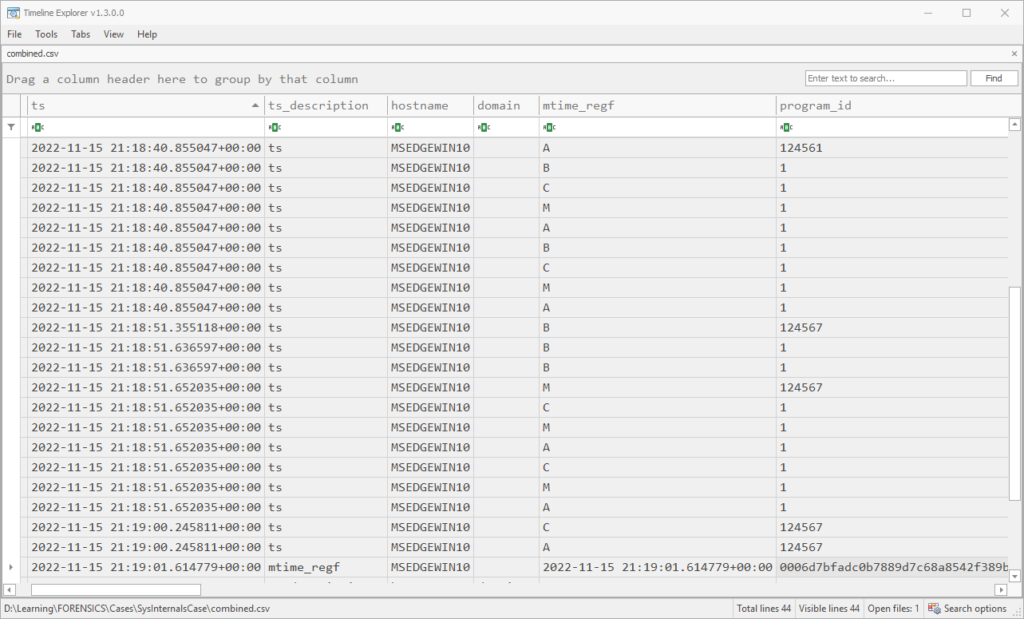
rdump --csv -w combined.csv amcache.rec mft_filtered.recIn this output combined.csv, we can see the last modification time for this amcache entry alongside the MFT events for the download:
Building a Mini Super-Timeline (Time Filtering)
Now that we have what seems like a strong indication of an execution event. I can add in lnk files and some user interaction artifacts in the same way, but now that we have a time I want to see if we can get a mini-timeline going, using the timestamp in the selector statement instead of our keyword “*sysinternals*”.
For this mini-timeline, I’m going to pick the artifacts mft, shimcache, amcache, shellbags, lnk, services, and runkeys. I would like to add scheduled tasks in, but for some reason the –multi-timestamp argument breaks this plugin (bummer). I’m selecting the minute before and after the amcache record to see if there’s anything additional and to pick up persistence mechanisms. Here is my draft command:
target-query -f shimcache,amcache,shellbags,lnk,services,runkeys SysInternalsCase.E01 | rdump --multi-timestamp -s "r.ts and r.ts >= datetime.datetime(2022,11,15,21,18) and r.ts <= datetime.datetime(2022,11,15,21,20)" --csv -w mini_timeline.recUnfortunately, the datetime and timedelta modules aren’t accessible from the string selector. We could try converting the timestamp to a string, but it is clunky and perhaps it is about time to switch to Python scripting here. Still, I feel that this should be an important use of the selector in rdump that should be supported. Last try at getting something working:
target-query -f shimcache,amcache,shellbags,lnk,services,runkeys SysInternalsCase.E01 | rdump --multi-timestamp -s "r.ts and r.ts.year == 2022 and r.ts.month == 11 and r.ts.day == 15 and r.ts.hour == 21 and r.ts.minute in range(18,20)" --csv -w mini_timeline.csvThis resulted in only 7 records in the outputted CSV. I opened up an issue with the flow.record module and one of the maintainers helped me realize my mistake here. rdump –multi-timestamp is the operation that breaks copies each timestamp in the record into its own event with an r.ts field, which means that the field is not yet present in the record in the first operation. I needed to pipe the output of –multi-timestamp to another rdump execution to select that field. Like so:
target-query -f shimcache,amcache,shellbags,lnk,services,runkeys SysInternalsCase.E01 | rdump --multi-timestamp -w - | rdump -s "r.ts and r.ts.year == 2022 and r.ts.month == 11 and r.ts.day == 15 and r.ts.hour == 21 and r.ts.minute in range(18,20)" --csv -w mini_timeline.csv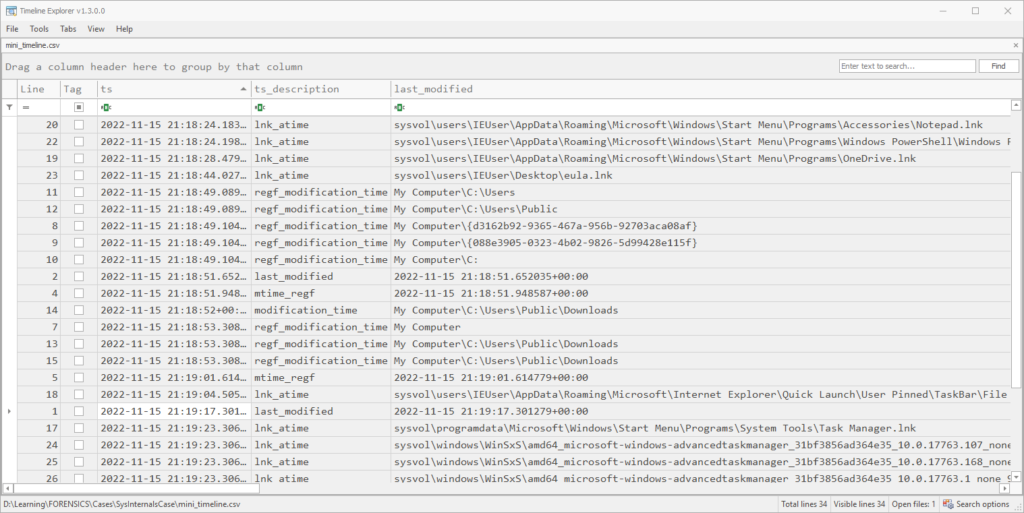
After sorting by timestamp, we get 29 rows of timestamped events, plus header rows. Between amcache, shimcache, shellbags and lnk files, we can see that the user navigated to the Public downloads folder and executed SysInternals.exe. Since there seems to have been a download, I want to add in the dissect function browsers to enumerate all browsers and extract relevant events. Running the following command took approximately 4 minutes and 15 seconds:
target-query -f shimcache,amcache,shellbags,lnk,services,runkeys,browsers SysInternalsCase.E01 | rdump --multi-timestamp -w - | rdump -s "r.ts and r.ts.year == 2022 and r.ts.month == 11 and r.ts.day == 15 and r.ts.hour == 21 and r.ts.minute in range(18,20)" --csv -w mini_timeline.csvIn addition to the information in the previous mini-timeline, the following URLs were extracted from the browser plugin, occurring in order:
| https://go.microsoft.com/fwlink/?LinkId=525773 |
| https://go.microsoft.com/ |
| ms-appx-web://microsoft.microsoftedge/ |
| ms-appx-web://microsoft.microsoftedge/assets/errorpages/dnserror.html?DNSError=11001&ErrorStatus=0x800C0005&NetworkStatusSupported=1 |
| ms-appx-web://microsoft.microsoftedge/assets/errorpages/dnserror.html?DNSError=11001&ErrorStatus=0x800C0005&NetworkStatusSupported=1 |
| https://www.msn.com/ |
| ms-appx-web://microsoft.microsoftedge/assets/errorpages/dnserror.html?DNSError=11001&ErrorStatus=0x800C0005&NetworkStatusSupported=1 |
| http://www.sysinternals.com/SysInternals.exe |
| http://www.sysinternals.com/SysInternals.exe |
It’s fascinating the malware seems to come from a well-known site. However, it’s not clear at this point that the user connected to the proper IP to download this file. To determine that, it would be nice to get some confirmation from event logs, especially the DNS client.
Trying out target-dump
I was thinking that there might be some benefit to dumping the content of all these plugins to jsonlines format instead, in case I want to do an operation on a particular artifact a bit more quickly or debug that artifact. I’m also curious if there are speed or memory benefits of this.
Note: It turns out there is a bug in target-dump and it doesn’t support plugin namespaces (yet). So for the amcache function specifically, I had to qualify the plugin names:
target-dump --restart -o . -f shimcache,amcache.files,amcache.application_files,amcache.programs,shellbags,lnk,services,runkeys,browsers SysInternalsCase.E01The output of this command creates a folder with the name of the endpoint, in this case MSEDGEWIN10. Then you can use this command to combine them all into one .jsonlines file:
rdump --multi-timestamp -J -w combined.jsonl MSEDGEWIN10/shimcache/windows_shimcache.jsonl MSEDGEWIN10/runkeys/windows_registry_run.jsonl MSEDGEWIN10/services/windows_service.jsonl MSEDGEWIN10/shellbags/windows_shellbag.jsonl MSEDGEWIN10/tasks/filesystem_windows_task_grouped.jsonlI also noticed that the –multi-timestamp argument doesn’t work with the task output filesystem_windows_task.json, which is why I left that file out in the above command. With that caveat in mind, we can use the same selector as before, but operating on combined.jsonl:
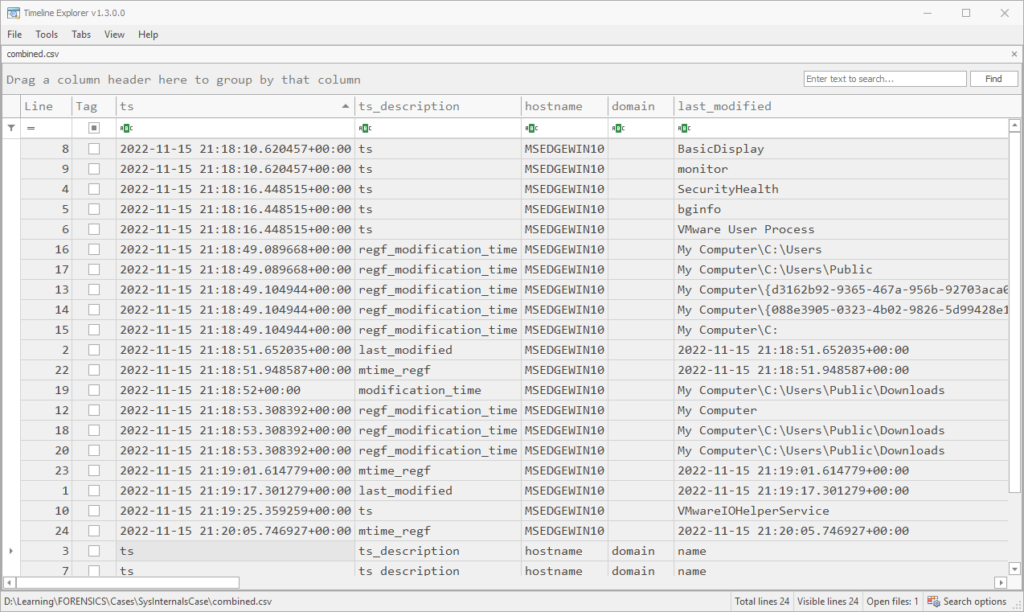
rdump --csv -w combined.csv -s "r.ts and r.ts.year == 2022 and r.ts.month == 11 and r.ts.day == 15 and r.ts.hour == 21 and r.ts.minute in range(18,21)" combined.jsonlHere is the result (combined.csv). We end up with 20 rows of timestamped events and 4 header rows:
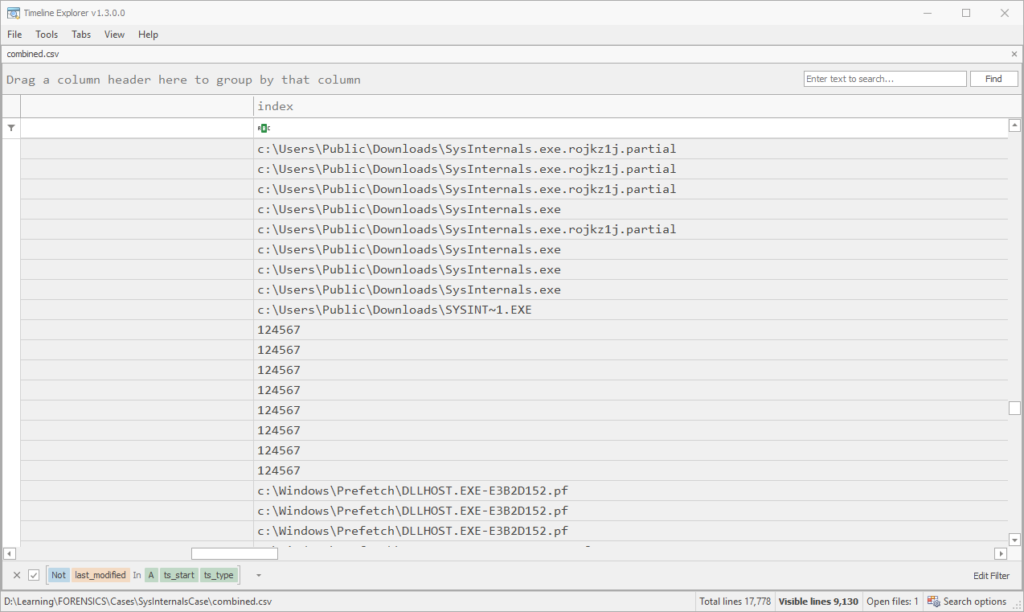
To flesh things out more like a proper timeline, I also did a target-dump of the mft, usnjrnl, browser.downloads, browser.history and evtx plugins, which took about 30 minutes, and followed the above steps to narrow down to the 3 minutes of interest. This resulted in about 18,000 rows in the CSV, good enough to start straining the eyes. Parsing the MFT or USN journal always takes forever, but you get so much more data than you might expect. For example, if I run the Prefetch plugin on this E01, or do a target-shell and go to the Prefetch folder, there’s no output (or .pf files found). Yet, the parsed MFT was able to show that they were created at the time (not for SysInternals.exe itself, though):
Conclusions and Recommendations
Next time, we can turn towards actually tackling the challenge with dissect. My recommendation for the time being is to set up dissect in an Ubuntu environment, separating it from other tools with a python virtual environment under pipx. I also recommend dumping plugin output to files at the beginning to save time when debugging or playing around.
For this challenge, I’m dumping the output of relevant plugins using target-dump and making a CSV mini-super-timeline of the couple of minutes surrounding the incident, just to get a general idea, then working the timeline forward as needed. I want to stick with text instead of jumping into the Python API just in case data isn’t in its proper field. In Part 2, we’ll attempt to reconstruct the story and focus on solving the challenge.
Also, apologies for all of the screenshots of shell output and CSVs! I’ll attempt to use the formatting tools in both dissect and WordPress in Part 2 to select particular columns and make it more readable. Thanks for reading!