If you’re curious about how dissect works, or why I took this approach to using it, have a look at my previous post.
Recap: Mini-Timelines
In Part 1, we hammered out an approach to pulling out a mini-timeline using dissect to get a bird’s-eye view for the 3 minutes surrounding the download event. The first approach, which saves all plugin output to the disk and reduces memory footprint, requires two commands to be run:
target-dump -o . --restart -f mft,evtx,usnjrnl,amcache.applaunches,amcache.application_files,amcache.applications,amcache.device_containers,amcache.drivers,amcache.files,amcache.programs,amcache.shortcuts,defender.evtx,defender.exclusions,defender.quarantine,shimcache,lnk,services,runkeys,shellbags,browser.history,browser.downloads,tasks SysInternalsCase.E01

rdump --multi-timestamp -J -w -MSEDGEWIN10/shimcache/windows_shimcache.jsonl MSEDGEWIN10/runkeys/windows_registry_run.jsonl MSEDGEWIN10/services/windows_service.jsonl MSEDGEWIN10/shellbags/windows_shellbag.jsonl MSEDGEWIN10/usnjrnl/filesystem_ntfs_usnjrnl.jsonl MSEDGEWIN10/mft/filesystem_ntfs_mft_std.jsonl MSEDGEWIN10/mft/filesystem_ntfs_mft_filename.jsonl MSEDGEWIN10/lnk/windows_filesystem_lnk.jsonl MSEDGEWIN10/browser/browser_ie_history.jsonl MSEDGEWIN10/browser/browser_ie_download.jsonl MSEDGEWIN10/evtx/filesystem_windows_evtx.jsonl MSEDGEWIN10/amcache/windows_appcompat_InventoryApplicationFile.jsonl MSEDGEWIN10/defender/filesystem_windows_defender_evtx.jsonl MSEDGEWIN10/defender/filesystem_windows_defender_exclusion.jsonl MSEDGEWIN10/tasks/filesystem_windows_task_grouped.jsonl | rdump --csv -w combined.csv -s "r.ts and r.ts.year == 2022 and r.ts.month == 11 and r.ts.day == 15 and r.ts.hour == 21 and r.ts.minute in range(18,21)"
It’s not necessarily true that each plugin will succeed, so it would be best to enumerate .jsonl files rather than specify them.
We can do the same thing with a one-liner for the output of target-query, but it will all happen in memory. The following is the one-liner equivalent without dumping all plugin output to disk (Note: I had to omit the tasks plugin from this list, as a bug fix for one of its fields is still making its way downstream. You can still dump raw tasks using target-dump):
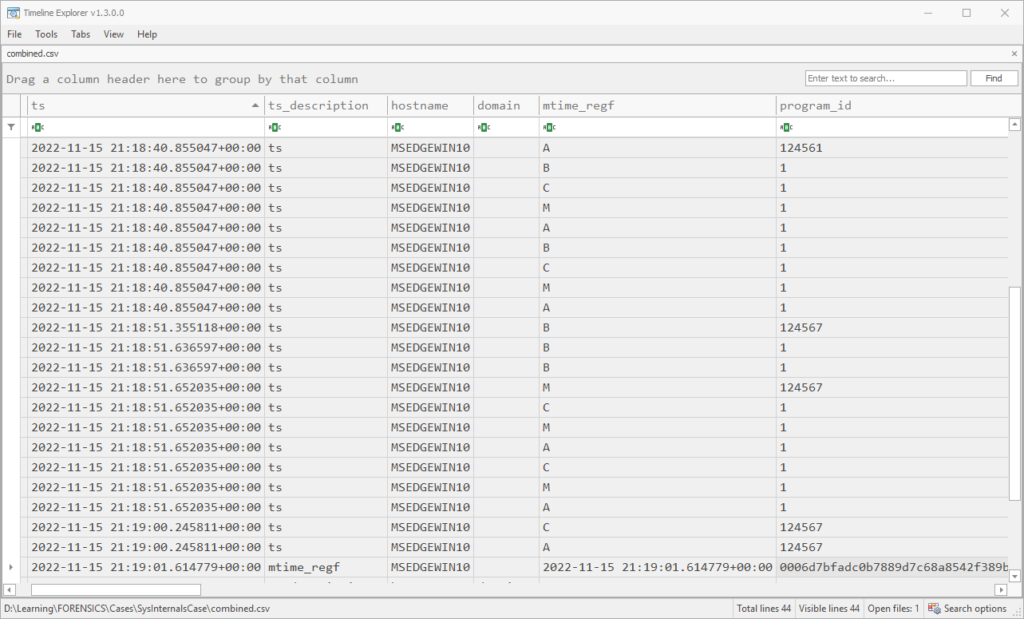
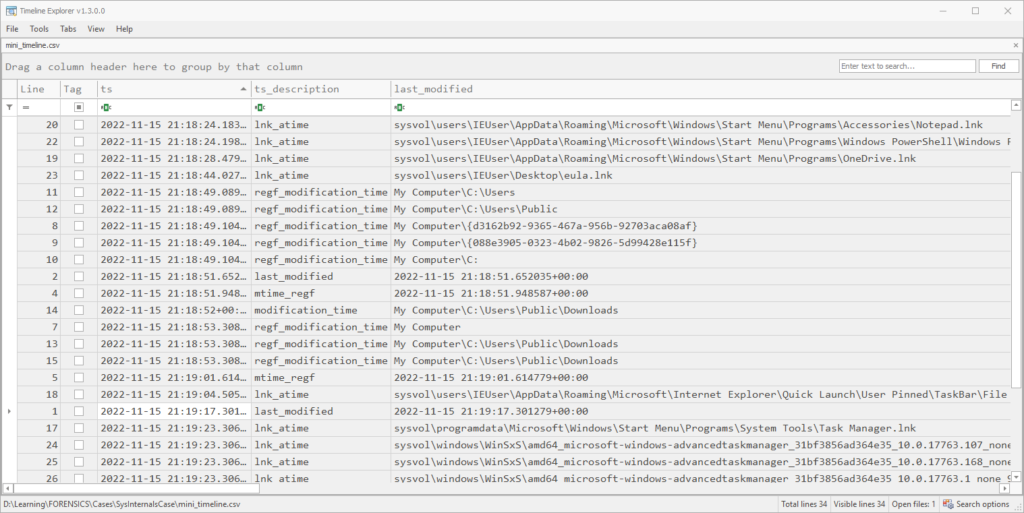
target-query -f mft,evtx,usnjrnl,defender,amcache,shimcache,lnk,services,runkeys,shellbags,browser.history,browser.downloads SysInternalsCase.E01 | rdump -w - --multi-timestamp | rdump --csv -w combined2.csv -s "r.ts and r.ts.year == 2022 and r.ts.month == 11 and r.ts.day == 15 and r.ts.hour == 21 and r.ts.minute in range(18,21)"If you’re running target-query and want to see which plugin fails, if one does, use the --report-dir option. With the resources I allocated to my WSL VM, this command took about 25 minutes and we end up with over 17,200 records. I did a good amount of scrolling through this and filtering output from columns to get a bird’s eye view, but in order to show interesting artifacts, I’ll just show the output of a couple of commands during that time period to get the same effect.
Root Cause
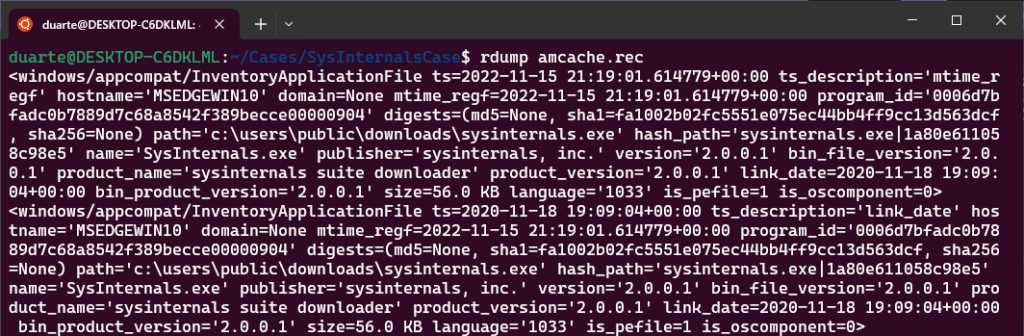
The first references to SysInternals in our output come from the browser.downloads and browser.history plugins:
target-query -f browser.history,browser.downloads SysInternalsCase.E01 | rdump --multi-timestamp -w - | rdump -f "{ts} {url} {path}" -s "r.ts and r.ts.year == 2022 and r.ts.month == 11 and r.ts.day == 15 and r.ts.hour == 21 and r.ts.minute in range(18,21)" | sort -n
...
2022-11-15 21:18:33.308250+00:00 https://go.microsoft.com/ {path}
2022-11-15 21:18:33.308250+00:00 https://go.microsoft.com/fwlink/?LinkId=525773 {path}
2022-11-15 21:18:33.355026+00:00 ms-appx-web://microsoft.microsoftedge/ {path}
2022-11-15 21:18:33.355026+00:00 ms-appx-web://microsoft.microsoftedge/assets/errorpages/dnserror.html?DNSError=11001&ErrorStatus=0x800C0005&NetworkStatusSupported=1 {path}
2022-11-15 21:18:33.386221+00:00 ms-appx-web://microsoft.microsoftedge/assets/errorpages/dnserror.html?DNSError=11001&ErrorStatus=0x800C0005&NetworkStatusSupported=1 {path}
2022-11-15 21:18:33.761377+00:00 https://www.msn.com/ {path}
2022-11-15 21:18:33.808432+00:00 ms-appx-web://microsoft.microsoftedge/assets/errorpages/dnserror.html?DNSError=11001&ErrorStatus=0x800C0005&NetworkStatusSupported=1 {path}
2022-11-15 21:18:40.824183+00:00 http://www.sysinternals.com/SysInternals.exe {path}
2022-11-15 21:18:40.824183+00:00 http://www.sysinternals.com/SysInternals.exe {path}
2022-11-15 21:18:52.073889+00:00 http://www.sysinternals.com/SysInternals.exe C:\Users\Public\Downloads\SysInternals.exe
I’ve removed the record headers and most of the fields to save space, but the last record, from browser.downloads, shows that the file at the path C:\Users\Public\Downloads\SysInternals.exe was downloaded from the url www.sysinternals.com/sysinternals.exe and finished downloading at 2022-11-15 21:18:52. Unfortunately the start timestamp for this download is None, but since we have the URL being visited at 21:18:40, that seems a fair approximation of when the download began.
Seeing that there were some DNS errors nearby in the browser history, I felt it would be good to check the local hosts file for any oddities, if it is still present. This is no problem using dissect with target-fs.
target-fs SysInternalsCase.E01 cat "C:\Windows\System32\Drivers\etc\hosts"

# Copyright (c) 1993-2009 Microsoft Corp.
#
# This is a sample HOSTS file used by Microsoft TCP/IP for Windows.
#
# This file contains the mappings of IP addresses to host names. Each
...

192.168.15.10   www.malware430.com

192.168.15.10   www.sysinternals.com
It appears that the local hosts file has been modified to redirect sysinternals[.]com traffic to a local IP address listed here, which would explain the malicious file being downloaded from a fairly well-known domain (but sysinternals.com could have been compromised all the same). It could be worth it to add this IP and the domain malware430[.]com to our searches as well, at some point.
In any case, the search backwards for the root cause of this incident is probably coming to a close. We can determine the modification date of the hosts file according to the MFT for good measure.
As far as I’m aware, there are 2 main ways of getting the last modification date of a particular file using dissect. We can either use target-shell and once inside the “shell” we can use the stat command on the hosts file, like so:
target-shell SysInternalsCase.E01
MSEDGEWIN10 /> stat 'C:\Windows\System32\Drivers\etc\hosts'
File: /C:/Windows/System32/Drivers/etc/hosts
Size: 896
Inode: 42564 Links: 1
Access: (0o777/-rwxrwxrwx) Uid: ( 0 ) Gid: ( 0 )
Access: 2022-11-15T21:18:11.308264
Modify: 2022-11-15T21:17:03.567879
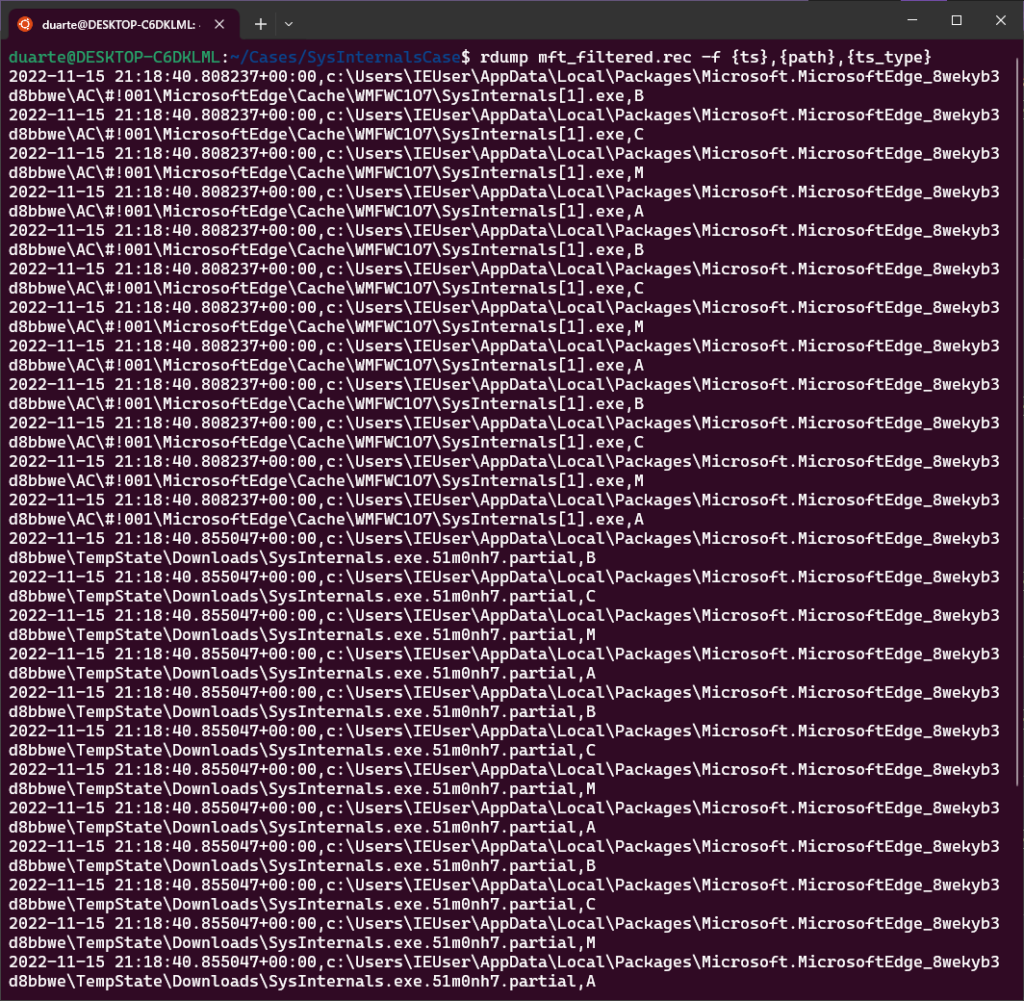
Change: 2018-09-15T07:31:36.585163Or, we could instead use the mft plugin to retrieve timestamps, using rdump to select the particular file. This would take forever using target-query if we had not already dumped the parsed MFT to disk using target-dump earlier. I’m curious if these timestamps all agree, so I parsed the 2 jsonl output files on disk with the following command:
rdump --count 8 -F ts_type,ts -s "r.path.match('c:\\Windows\\System32\\drivers\\etc\\hosts')" MSEDGEWIN10/mft/filesystem_ntfs_mft_std.jsonl MSEDGEWIN10/mft/filesystem_ntfs_mft_filename.jsonlThe downside to this approach is that dissect uses the pathlib Python library, which has some quirks in regards to path naming. The drive path c: happens to be lowercase, and if you take this approach searching for a path and use an uppercase drive path, dissect will loop through both MFTs and return with no results.
Another thing to note is, I initially ran this command with --count 2 to have dissect stop after finding the record corresponding to this file in both the Standard_Info and Filename MFTs, but it turns out target-dump split the record into multiple records for each timestamp (or maybe I made some mistake in the original dump).
In any case, since we expect at most the 4 MACB timestamps for each of the two MFT entries, I upped the limit to 8. Here was the result:
<filesystem/ntfs/mft/std ts_type='B' ts=2018-09-15 07:31:36.585163>
<filesystem/ntfs/mft/std ts_type='C' ts=2022-11-15 21:17:03.567879>
<filesystem/ntfs/mft/std ts_type='M' ts=2022-11-15 21:17:03.567879>
<filesystem/ntfs/mft/std ts_type='A' ts=2022-11-15 21:18:11.308264>
<filesystem/ntfs/mft/fn ts_type='B' ts=2019-03-19 21:53:31.200783>
<filesystem/ntfs/mft/fn ts_type='C' ts=2019-03-19 21:53:31.200783>
<filesystem/ntfs/mft/fn ts_type='M' ts=2019-03-19 21:53:31.200783>
<filesystem/ntfs/mft/fn ts_type='A' ts=2019-03-19 21:53:31.200783>
What’s interesting is that all of the Filename timestamps for this file are aligned at a date that is in between the Birth date and the last Modification date. This could be a sign of timestomping, but could just as likely indicate that the file was copied or moved from another volume at that time.
What’s more, we can see that the Standard_Information timestamps basically align with the output we get from the stat command, the only differences being that the stat command only outputs the timestamps for file Access, Modification, and Change (of file inode). In this case the Change timestamp from Unix aligns with the Birth timestamp from Windows. Although the stat command gives us the reliable and informative Standard_Information timestamps, it behooves us to stick with the parsed MFT for more granular information.
For example, using the timestamps parsed by the MFT we can see that the Modification and Change timestamps align at 2022-11-15 21:17:03.567879, which gives us confidence that a file modification of the hosts file happened at that time. This folds into our narrative that the file was modified right before the download of the malicious executable.
We can already see via our mini-timeline that the birth timestamp for Sysinternals.exe in the user’s Downloads folder is approximately 2022-11-15 21:18:51 UTC. With this in mind, we can start working forward in time looking for signs of malicious activity and persistence on MSEDGEWIN10.
What About Defender?
Before going onto malicious action, I’m curious what Windows Defender thought of this file, if it was active. Let’s query using the defender plugin for the time in question:
target-query -f defender SysInternalsCase.E01 | rdump --multi-timestamp -w - | rdump -s "r.ts and r.ts.year == 2022 and r.ts.month == 11 and r.ts.day == 15 and r.ts.hour == 21 and r.ts.minute in range(18,21)"Hmm, I got no output from this, as in no event log or timestamped records associated with quarantining or exclusion during our 3 minutes. Maybe there are few enough logs that we can look at the entire day instead. Let’s modify the query a bit:
target-query -f defender SysInternalsCase.E01 | rdump --multi-timestamp -w - | rdump -s "r.ts and r.ts.year == 2022 and r.ts.month == 11 and r.ts.day == 15"

<filesystem/windows/defender/exclusion ts=2022-11-15 21:17:00.942986+00:00 ts_description='regf_mtime' hostname=None domain=None regf_mtime=2022-11-15 21:17:00.942986+00:00 type='Paths' value='C:'>
So the only record we get back from 11-15 explains why we have no Defender-related activity in general. It looks like someone excluded the entire C: drive from Defender scanning at 21:17, minutes before the time of the download. It would be great to get the username that did the modification in the record, but since there’s only one real user on the system (IEUser), I think we’re safe to move on.
Execution Time
Now I think it’s time to figure out if there is any consensus around when SysInternals.exe was launched. I did a bit of scouring of the available artifacts to see if I could find anything new in the dissect plugins to throw together. I came up with the following:
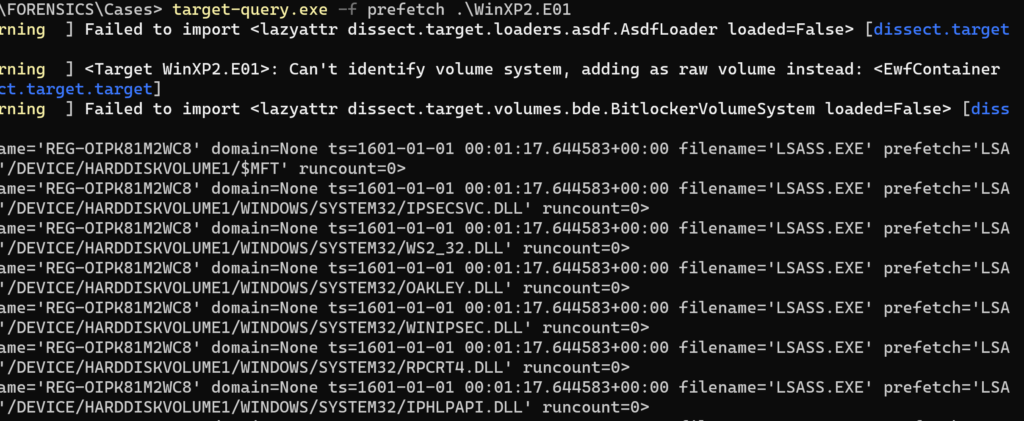
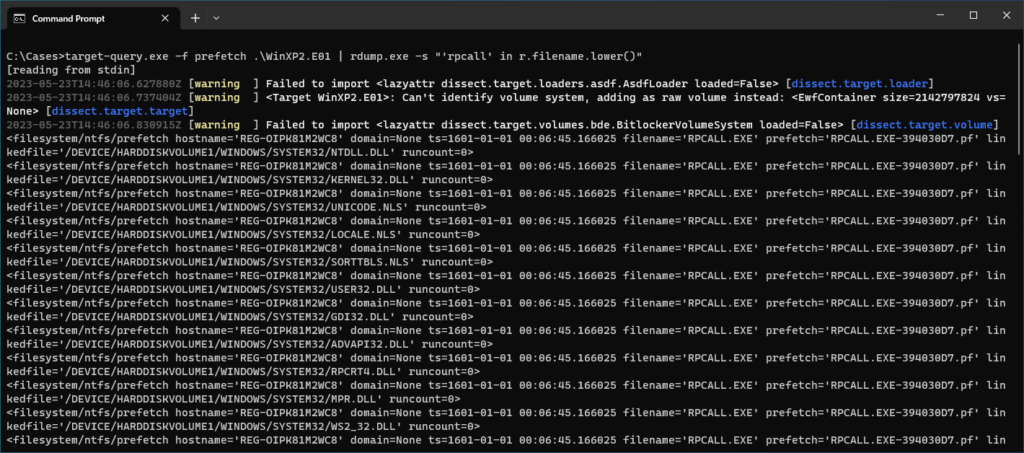
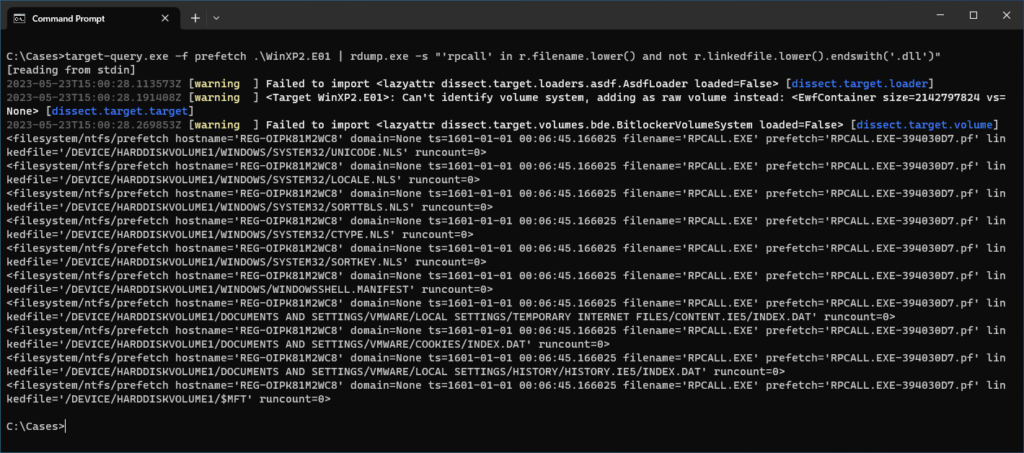
target-query -f userassist,shimcache,amcache,bam,prefetch,sru.application_timeline,sru.application,activitiescache SysInternalsCase.E01 | rdump --multi-timestamp -w - | rdump -s "r.ts and r.ts.year == 2022 and r.ts.month == 11 and r.ts.day == 15 and r.ts.hour == 21 and r.ts.minute in range(18,21) and 'sysinternals' in str(r).lower()"I would typically add a couple of things to this, including event logs (EID 4688 for one), but although some process auditing seemed to be enabled and 4688s were recorded, nothing was relevant here. Also, it was notable that the activitiescache plugin didn’t typically include the path to the executable referred to in the activity, but just gave it a name. I manually checked out those records as well, and didn’t find anything relevant to the execution of SysInternals.exe. Also, there were no Prefetch records or files on disk, as noted in my earlier blog, even though in the MFT and USNJrnl we see Prefetch files being created.
While those three sources weren’t very fruitful, we still get enough information from the remaining artifacts to get a picture of the execution. After putting the records in order (I used rdump -J and piped to sort to sort them by timestamp) we get the following:
- 21:18:51 – Shimcache last modified time
- 21:19:00 – UserAssist execution timestamp (GUI user interaction)
- 21:19:01 – Amcache registry modification time
- 21:19:36 – Background Activity Monitor (BAM) timestamp
- 21:19:55 – System Resource Usage (SRU) Application Timeline End Time
This last one was pretty interesting to me, as it also comes with an included duration of 59994 milliseconds, almost exactly a minute. This would put its start time for SysInternals.exe at 21:18:55, 5 seconds before UserAssist. I felt that this was a bit of an odd gap so I had a look at the whole application_timeline record in dissect:
target-query -f sru.application_timeline,sru.application SysInternalsCase.E01 | rdump -s "'sysinternals' in str(r.app).lower()"

<filesystem/windows/sru/application_timeline hostname='MSEDGEWIN10' domain=None ts=2022-11-15 21:21:00+00:00 app='!!SysInternals.exe!2020\11\18:19:09:04!0!' user='S-1-5-21-321011808-3761883066-353627080-1000' flags=17563650 end_time=2022-11-15 21:19:55.186077+00:00 duration_ms=59994 span_ms=60000 timeline_end=407360150 in_focus_timeline=None user_input_timeline=None comp_rendered_timeline=None comp_dirtied_timeline=None comp_propagated_timeline=None audio_in_timeline=None audio_out_timeline=None cpu_timeline=639 disk_timeline=None network_timeline=49 mbb_timeline=None in_focus_s=None psm_foreground_s=None user_input_s=None comp_rendered_s=None comp_dirtied_s=None comp_propagated_s=None audio_in_s=None audio_out_s=None cycles=492526653 cycles_breakdown=71776119061217280 cycles_attr=10465119 cycles_attr_breakdown=71776119061217280 cycles_wob=None cycles_wob_breakdown=None disk_raw=None network_tail_raw=75675 network_bytes_raw=609227 mbb_tail_raw=None mbb_bytes_raw=None display_required_s=None display_required_timeline=None keyboard_input_timeline=None keyboard_input_s=None mouse_input_s=None>
Since it seemed to have another timestamp, this gave me some pause about the artifact and I wanted a second opinion about what they each mean. First, I saved the SRUDB.dat file from the challenge locally using target-fs, then I opened it using the NirSoft tool Application Resources Usage Viewer.
target-fs SysInternalsCase.E01 cp "C:\Windows\System32\sru\SRUDB.dat"Unfortunately, the artifact I was looking for was actually missing from this tool so I ended up using ESEDatabaseView and finding the event there. I won’t go into it here but I didn’t get any additional information from those tools. It looks like for SRUDB the closest we get to a start time for the application is based on the duration and end time.
Overall, I still like the UserAssist timestamp the best here, since it’s tied to user interaction via the GUI and aligns closely with the amcache timestamp. I think it’s safe to say that the user executed SysInternals.exe at approximately 2022-11-15 21:19:00.
Dropped/Downloaded Files
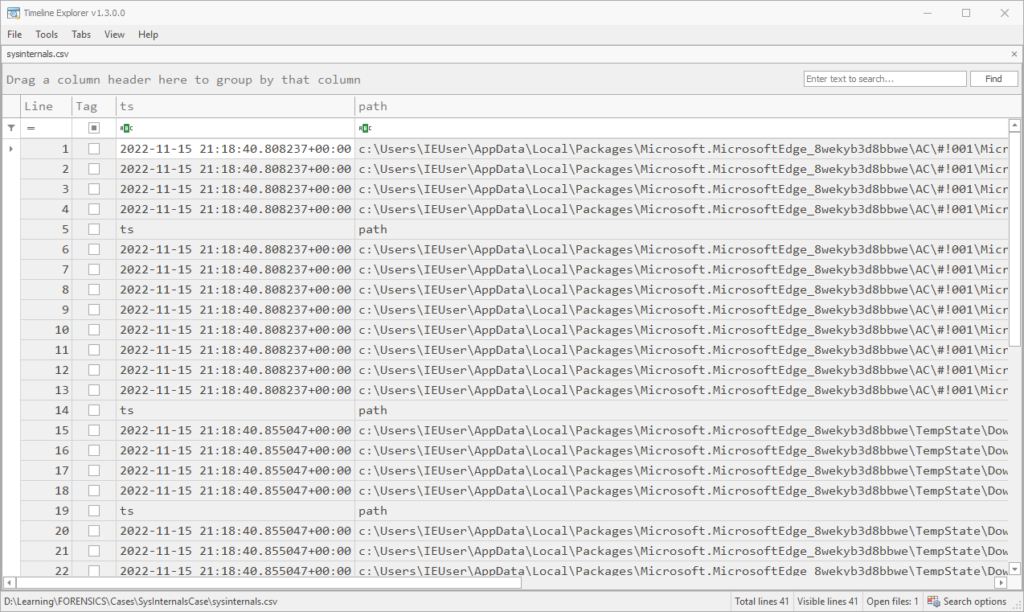
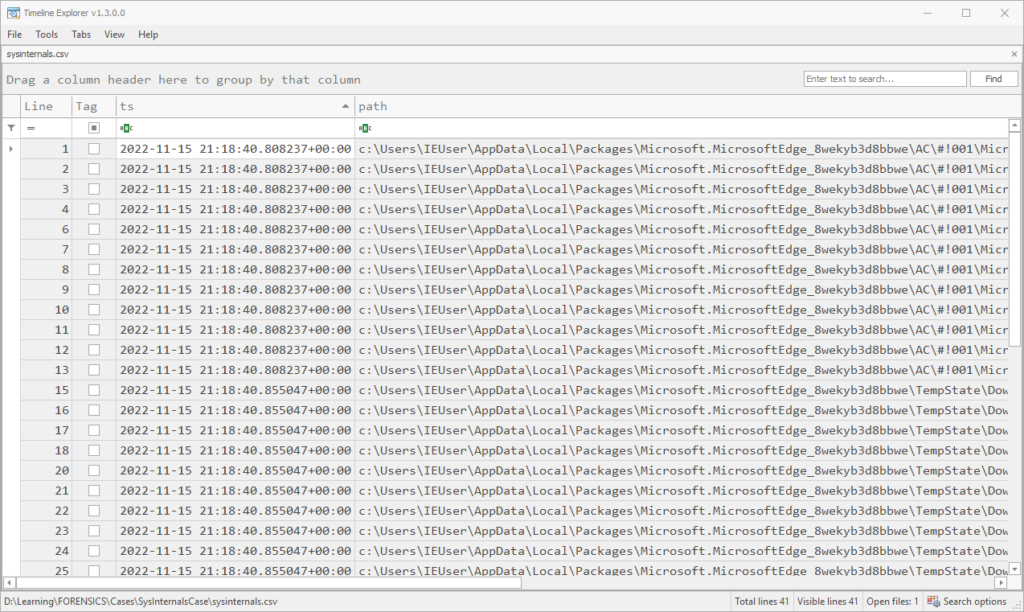
Identifying files dropped or downloaded by malware using forensic data can be a pain, especially because malware often delays its own execution purposefully. Narrowing the window to “new” files in between 21:19 and 21:20 (timeframe taken from the application end time in the SRU artifact), we can make a fairly short list. We could just grep through the jsonl to save time, but if we utilize rdump we can easily select fields to display before filering:
rdump -f "{ts} {path} {filesize} {ts_type}" MSEDGEWIN10/mft/filesystem_ntfs_mft_std.jsonl | grep -E "B$" | grep -E "2022-11-15 21:(19|20)" | sortLeaving out files that just look like index or cache files, there are only a couple interesting ones left:
2022-11-15 21:19:17.287640 c:\Users\IEUser\AppData\Local\Microsoft\Windows\INetCache\IE\WNC4UP6F\VMwareUpdate[1].exe 0.28 MB B
2022-11-15 21:19:17.287640 c:\Windows\VMTOOL~1.EXE 0.28 MB B
2022-11-15 21:19:17.287640 c:\Windows\vmtoolsIO.exe 0.28 MB B
...
2022-11-15 21:19:22.040771 c:\Windows\Prefetch\VMTOOLSIO.EXE-B05FE979.pf 2.43 KB B
2022-11-15 21:19:22.040771 c:\Windows\Prefetch\VMTOOL~2.PF 2.43 KB B
From these created files, it appears that vmtoolsIO.exe was both downloaded and potentially executed in a matter of 5 seconds. I repeated our command to find execution artifacts for this file to verify (slightly different time frame):
target-query -f userassist,shimcache,amcache,bam,prefetch,sru.application_timeline,sru.application,activitiescache SysInternalsCase.E01 | rdump --multi-timestamp -w - | rdump -L -F ts,ts_description,app,path,user,duration_ms -s "r.ts and r.ts.year == 2022 and r.ts.month == 11 and r.ts.day == 15 and r.ts.hour == 21 and r.ts.minute in range(19,22) and 'vmtoolsio' in str(r).lower()"

--[ RECORD 1 ]--
            ts = 2022-11-15 21:19:17.301279+00:00
ts_description = last_modified
          path = C:\Windows\vmtoolsIO.exe
--[ RECORD 2 ]--
            ts = 2022-11-15 21:21:00+00:00
ts_description = ts
           app = !!vmtoolsIO.exe!2020\11\18:19:10:20!0!
          user = S-1-5-21-321011808-3761883066-353627080-1000
   duration_ms = 59994
--[ RECORD 3 ]--
            ts = 2022-11-15 21:19:55.186077+00:00
ts_description = end_time
           app = !!vmtoolsIO.exe!2020\11\18:19:10:20!0!
          user = S-1-5-21-321011808-3761883066-353627080-1000
   duration_ms = 59994
--[ RECORD 4 ]--
            ts = 2022-11-15 21:21:00+00:00
ts_description = ts
           app = !!vmtoolsIO.exe!2020\11\18:19:10:20!0!
          user = S-1-5-18
   duration_ms = 131338
--[ RECORD 5 ]--
            ts = 2022-11-15 21:20:59.395466+00:00
ts_description = end_time
           app = !!vmtoolsIO.exe!2020\11\18:19:10:20!0!
          user = S-1-5-18
   duration_ms = 131338
--[ RECORD 6 ]--
            ts = 2022-11-15 21:21:00+00:00
ts_description = ts
           app = \Device\HarddiskVolume1\Windows\vmtoolsIO.exe
          user = S-1-5-18
I decided to use the -L option this time, since as expected it greatly enhances readability. I’m a fan. While some things are a little confusing here since there are multiple timestamps for each record, it was somewhat necessary to properly time filter. Record 1 is actually a shimcache record, with a timestamp about .02 seconds after the birth record for vmtoolsIO.exe. That’s fast! The next 4 timestamped records are 2 Application Timeline records from the SRU database (which have 2 timestamps each), and the last record is an Application record from the same database, which has only one timestamp.
Since the 2 Application Timeline records seem to show different durations, it’s unclear if this might represent 2 seperate executions of the same file or not. What seems consistent is that the timestamp end_time always seems to be before the other unlabeled timestamp ts, which is pretty confusing. But that’s probably a rabbit hole deserving of its own article. Onto the next part:
Persistence
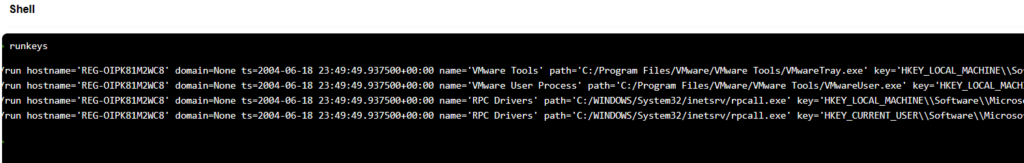
Now that we have two files related to the malware, we can do a look through various persistence mechanisms to determine whether and where the malware installed itself. As far as registry persistence, dissect mainly has the runkeys plugin. It would normally behoove us to extract all registry hives and run RegRipper to get a comprehensive look at possible registry persistence, but I’ll stick with dissect for now and see what all we recover. These are the persistence techniques I think we can cover with dissect:
- Runkeys AKA Auto-Start Extensibility Points
- Scheduled Tasks
- Services
- Shortcuts in Startup folder
- Installed browser extensions
These and a scan of registry persistence using another tool would cover persistence for many malware families, but dissect lacks the ability to identify more surreptitious persistence modifications, like Image Hijacks, modifications to the KnownDLLs list, print providers and WMI Event subscriptions (and of course, bootkits and firmware implants).
Several of these methods are registry-based and would be possible to add to the dissect framework. There is also the startupinfo plugin, which parses the StartupInfo.xml files listing programs that run in the first 90 seconds after the user logs in; this could help identify any lingering active persistence. But for now we’ll work with what we have. What I want to do is include anything matching on the keywords of our known files (SysInternals.exe and vmtoolsIO.exe) as well as anything registered in the near timeframe:
target-query -f browser.extensions,runkeys,services SysInternalsCase.E01 | rdump --multi-timestamp -w - | rdump -L -s "(r.ts and r.ts.year == 2022 and r.ts.month == 11 and r.ts.day == 15 and r.ts.hour == 21 and r.ts.minute in range(18,23)) or ('sysinternals' in str(r).lower() or 'vmtoolsio' in str(r).lower())"This was my general strategy for persistence, but I needed to run the lnk and tasks plugins separately. The tasks plugin needs to be run without --multi-timestamp because a bug fix is still making its way to release, and the lnk plugin is fairly noisy and we are only concerned with one persistence location:
target-query -f lnk,tasks SysInternalsCase.E01 | rdump -L -s "(r.lnk_path and r.lnk_path.match('*\\Start Menu\\Programs\\Startup\\*')) or 'sysinternals' in str(r).lower() or 'vmtoolsio' in str(r).lower()"The second command returns no records, but there is one of interest from the first command:
--[ RECORD 7 ]--
             ts = 2022-11-15 21:19:25.359259+00:00
 ts_description = ts
       hostname = MSEDGEWIN10
         domain = None
           name = VMwareIOHelperService
    displayname = VMWare IO Helper Service
     servicedll = None
      imagepath = c:\Windows\vmtoolsIO.exe
 imagepath_args =
     objectname = NT AUTHORITY\SYSTEM
          start = Auto Start (2)
           type = Service - Own Process (0x10)
   errorcontrol = Normal (1)
        _source = None
_classification = None
     _generated = 2024-01-12 23:42:07.634423+00:00
       _version = 1
With a timestamp of the service being in our execution window, it looks like this VMware IO Helper Service is a good candidate for the malware’s persistence. Now that we have that, we can take a “quick” look at the parsed event logs to see whether the service triggered and when. We can either grep for the service Display Name in the jsonl output from target-dump or be we can more thorough with rdump like so (this is fairly fast):
rdump -L -s "r.ts and r.ts.year==2022 and r.ts.month==11 and r.ts.day==15 and r.ts.hour==21 and r.ts.minute in range(19,23) and r.Provider_Name=='Service Control Manager'" MSEDGEWIN10/evtx/filesystem_windows_evtx.jsonl

...
--[ RECORD 1 ]--
                     hostname = MSEDGEWIN10
                       domain = None
                           ts = 2022-11-15 21:19:22.026651+00:00
                Provider_Name = Service Control Manager
                      EventID = 7045
                  AccountName = NT AUTHORITY\SYSTEM
                      Channel = System
                     Computer = MSEDGEWIN10
       Correlation_ActivityID = None
Correlation_RelatedActivityID = None
           EventID_Qualifiers = 16384
                EventRecordID = 975
          Execution_ProcessID = 692
           Execution_ThreadID = 6572
                    ImagePath = c:\Windows\vmtoolsIO.exe
                     Keywords = 0x8080000000000000
                        Level = 4
                       Opcode = 0
     Provider_EventSourceName = Service Control Manager
                Provider_Guid = {555908d1-a6d7-4695-8e1e-26931d2012f4}
              Security_UserID = S-1-5-21-321011808-3761883066-353627080-1000
                  ServiceName = VMWare IO Helper Service
                  ServiceType = user mode service
                    StartType = demand start
                         Task = 0
                      Version = 0
                      _source = SysInternalsCase.E01
              _classification = None
                   _generated = 2024-01-09 00:13:09.306075+00:00
                     _version = 1
--[ RECORD 2 ]--
                     hostname = MSEDGEWIN10
                       domain = None
                           ts = 2022-11-15 21:19:25.359259+00:00
                Provider_Name = Service Control Manager
                      EventID = 7040
                      Channel = System
                     Computer = MSEDGEWIN10
       Correlation_ActivityID = None
Correlation_RelatedActivityID = None
           EventID_Qualifiers = 16384
                EventRecordID = 976
          Execution_ProcessID = 692
           Execution_ThreadID = 8108
                     Keywords = 0x8080000000000000
                        Level = 4
                       Opcode = 0
     Provider_EventSourceName = Service Control Manager
                Provider_Guid = {555908d1-a6d7-4695-8e1e-26931d2012f4}
              Security_UserID = S-1-5-21-321011808-3761883066-353627080-1000
                         Task = 0
                      Version = 0
                       param1 = VMWare IO Helper Service
                       param2 = demand start
                       param3 = auto start
                       param4 = VMwareIOHelperService
                      _source = SysInternalsCase.E01
              _classification = None
                   _generated = 2024-01-09 00:13:09.307208+00:00
                     _version = 1
Here we can see records for Security Event IDs 7045 and 7040, respectively for a new service being registered, and the start type being changed (from demand start to auto-start). We don’t see any indication that the service was started manually before being set to auto-start at the next boot. Just out of curiosity, I also ran the below keyword search across parsed event logs, removing time and event provider restrictions, and got the same two events:
rdump -L -s "'vmware io helper service' in str(r).lower() or 'vmtoolsio.exe' in str(r).lower() or 'sysinternals.exe' in str(r).lower()" MSEDGEWIN10/evtx/filesystem_windows_evtx.jsonlBut even with all of this done, we don’t really know what the malware does…
Malicious Activity
It’s difficult to track particular changes to the registry as forensic data or assign changes in files to a particular process when so much is going on in the operating system. This is why malware forensics is a difficult subject often left to the malware analyst. In this case, we’re left with the time-honored tradition of scrolling through our mini super-timeline to look for anything suspicious.
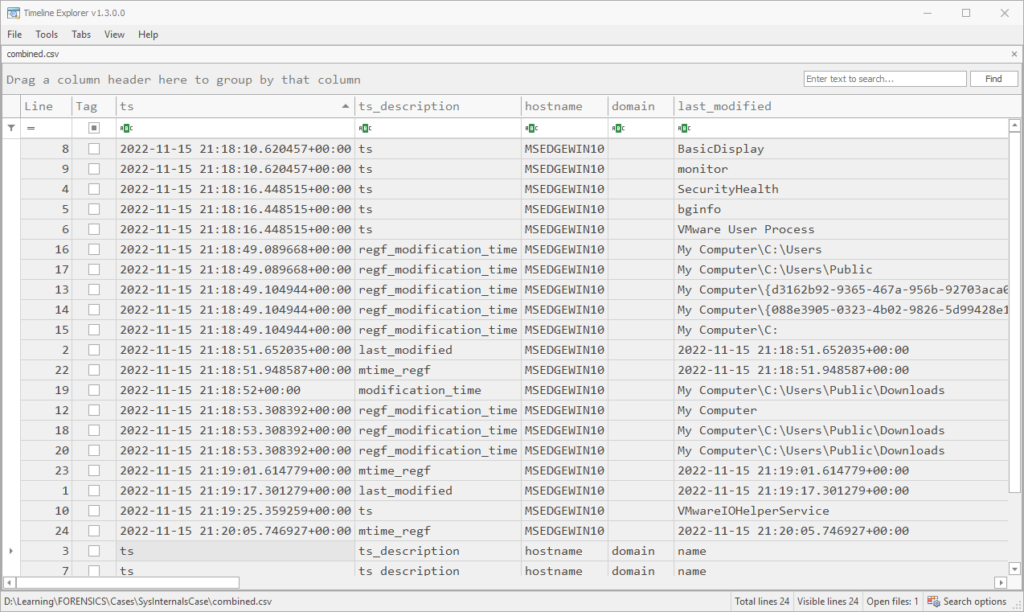
I started with refining the CSV a bit. Filtering out Access records from the MFT cuts our total in half. Then scrolling down past our SysInternals.exe execution approximation of 21:19:00, there wasn’t much of note that I could see, besides the download and execution of vmtoolsIO.exe. At about 21:19:22 we see the creation of Prefetch records for vmtoolsIO.exe and its service being installed in the system.
Directly after that there is a curious Security Event of ID 4672 “Special Privileges Assigned To New Logon”. The following privileges were assigned:
- SeAssignPrimaryTokenPrivilege
- SeTcbPrivilege
- SeSecurityPrivilege
- SeTakeOwnershipPrivilege
- SeLoadDriverPrivilege
- SeBackupPrivilege
- SeRestorePrivilege
- SeDebugPrivilege
- SeAuditPrivilege
- SeSystemEnvironmentPrivilege
- SeImpersonatePrivilege
- SeDelegateSessionUserImpersonatePrivilege
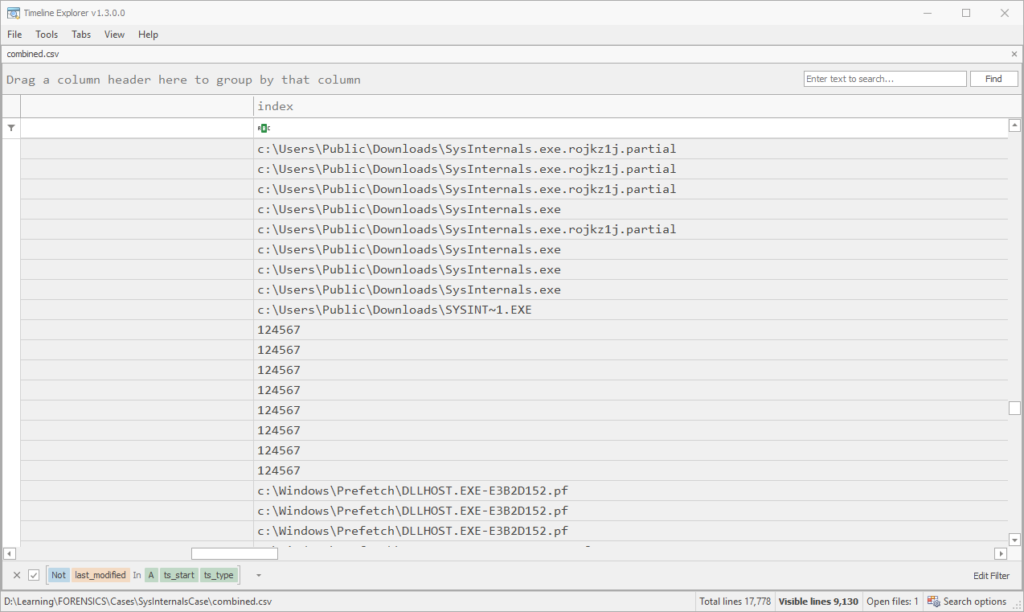
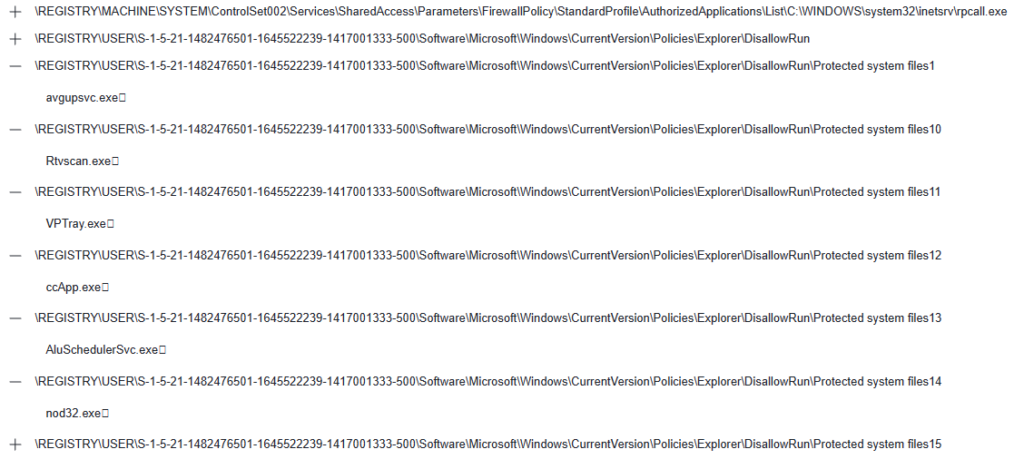
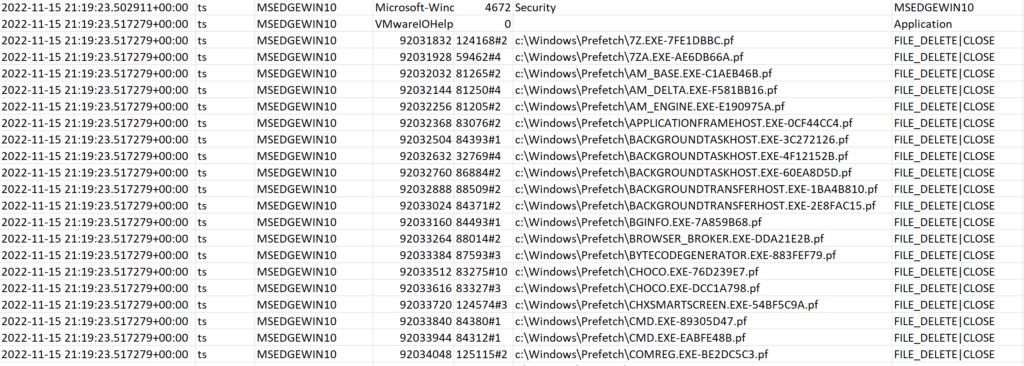
Of these, SeDebugPrivilege and SeLoadDriverPrivilege are quite powerful. After this at 21:19:23, we see via USNJrnl records a fairly suspicious pattern of Prefetch files being deleted from C:\Windows\Prefetch in alphabetical order:
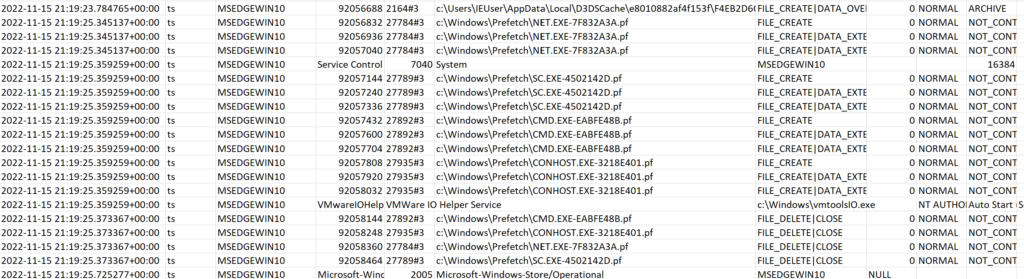
Further along, there are some creations of Prefetch files for cmd.exe, sc.exe and net.exe. We can only guess at what commands may have been run here, but the timestamps for the Prefetch creations are sandwiched between the modification of the VMware IO Helper Service from on-demand to auto-start. So this could have been a modification of the service using the sc command:
Aside from this, we see that the original file at C:\Users\Public\Downloads\SysInternals.exe is deleted at 21:20:58. If there is any activity after that, which is certainly possible, it falls outside of our mini-timeline. This all suggests that whatever the full functionality of SysInternals.exe may be, it seems to download an anti-forensic tool as part of its operations (vmtoolsIO.exe).
Conclusion
Let’s sum up what we found in this challenge as a timeline:
- On 2022-11-15 at 21:17:00 UTC, someone excluded the C:\ drive from Windows Defender scanning.
- At 21:17:03 the hosts file was modified to redirect traffic from the sysinternals.com domain to the local IP
192.168.15.10. - At 21:18:40 the user IEUser browsed to https://sysinternals.com/SysInternals.exe and downloaded a file from
192.168.15.10, which finished downloading to C:\Users\Public\Downloads\ at about 21:18:52. - The user executed SysInternals.exe at approximately 21:19:00 UTC.
- SysInternals.exe downloaded and executed another file named vmtoolsIO.exe to C:\Windows\vmtoolsIO.exe at about 21:19:17.
- vmtoolsIO.exe registered a Windows service with display name “VMware IO Helper Service” at 21:19:22 for its own persistence, and at 21:19:23 began deleting files ending in the extension .pf from C:\Windows\Prefetch.
- vmtoolsIO.exe modified its service to auto-start at boot at 21:19:25.
- SysInternals.exe was deleted from C:\Users\Public\Downloads at 21:20:58.
So malware forensics is pretty hard! It’s only fair that we check our work in a later blog with some malware analysis. Thank you for reading.